What is it worth? Using data to support business valuation
What is it worth?
How often do you consider the value of your business? If you are a professional adviser, how often does this question come up in conversation? What do you need in order to successfully undertake a business valuation?
As the saying goes, you only sell your business once. The last thing a vendor wants is to be left with the feeling that they have been underpaid and their life’s work has been undervalued. This applies to any dilutive event (one that results in a reduction of ownership for shareholders). Whether it is an outright exit of the business, the sale of a stake in the company or accepting fresh capital through a third-party investment, you need to accurately value your business.
The valuation negotiation is a dance. However, it is a misunderstanding that each party simply puts their “finger in the air” before coming up with a number and meeting in the middle. Undoubtedly, vendors may have a figure in mind. But that figure is often derived from what they want rather than from a fundamental analysis of their business. The real question is, when dancing, who has the best moves? Being a great negotiator is a neat step, as is having competition in the process (more than one interested party). But the winner of the dance-off probably has the most robust data too.
valuing a business – What techniques can we use?
Googling “How to value a business” will bring up thousands of hits. Results will range from generic business valuation calculators to references to dozens of common methodologies. The International Private Equity Valuation Guidelines provide a comprehensive guide on acceptable techniques.
Some valuation methods are more appropriate for specific types of businesses. A property-backed business may be at least partly judged on its asset value, while an infrastructure asset with predictable, secure, long-term cashflows may be valued using a discounted cash flow model.
Most business valuations (especially in the small and mid-market) are determined by reference to a multiple. Typically, this is a multiple of profits, usually defined as EBITDA (earnings before interest, tax, depreciation and amortisation) but, increasingly, revenue multiples are used, most commonly in industries (such as software) where profits are suppressed through outsized investment into top-line growth.
So, what is the right multiple?
To find the right multiple, we must first track down transactions in similar businesses to the company being valued. What did these enterprises sell for and what multiple of their profits did this represent?
To most, a similar business is one in the same industry conducting (broadly) the same activity. This makes sense as businesses in the same industry should have similar characteristics and, therefore, be of similar worth to a buyer.
However, the analysis does not stop there. The right multiple depends on a variety of factors. We can distil these down to four – Predictability of revenue; Industry; Growth; and Size – “PIGS” is the unfortunate acronym.
P- Predictability
Predictable revenues can mean a high level of repeat business. However, much stronger than repeat revenues are contractual revenues that roll from one year to the next. This de-risks a business plan by demonstrating security of income. This security of income means buyers can appraise future revenue and profits with a greater degree of certainty. A seller will always portray the best possible picture of the future performance of their business (after all, the acquirer is buying into the future, not the past, trading). It follows, therefore, that the more comfortable the buyer will be with this future performance, the higher the multiple they will attach to the target company’s revenues,
The technology sector offers a good insight into this. Technology is a broad church but, for our purposes, we split it into Software-as-a-Service (“SaaS”) and Hardware companies. Whilst both come under the “technology” sector and may be serving similar end markets with similar characteristics, they have very different revenue models. SaaS businesses will typically sign customers for annual or multi-year contracts, which will roll from one year to the next. Conversely, the revenues of a technology hardware business are likely to be more one-off in nature.
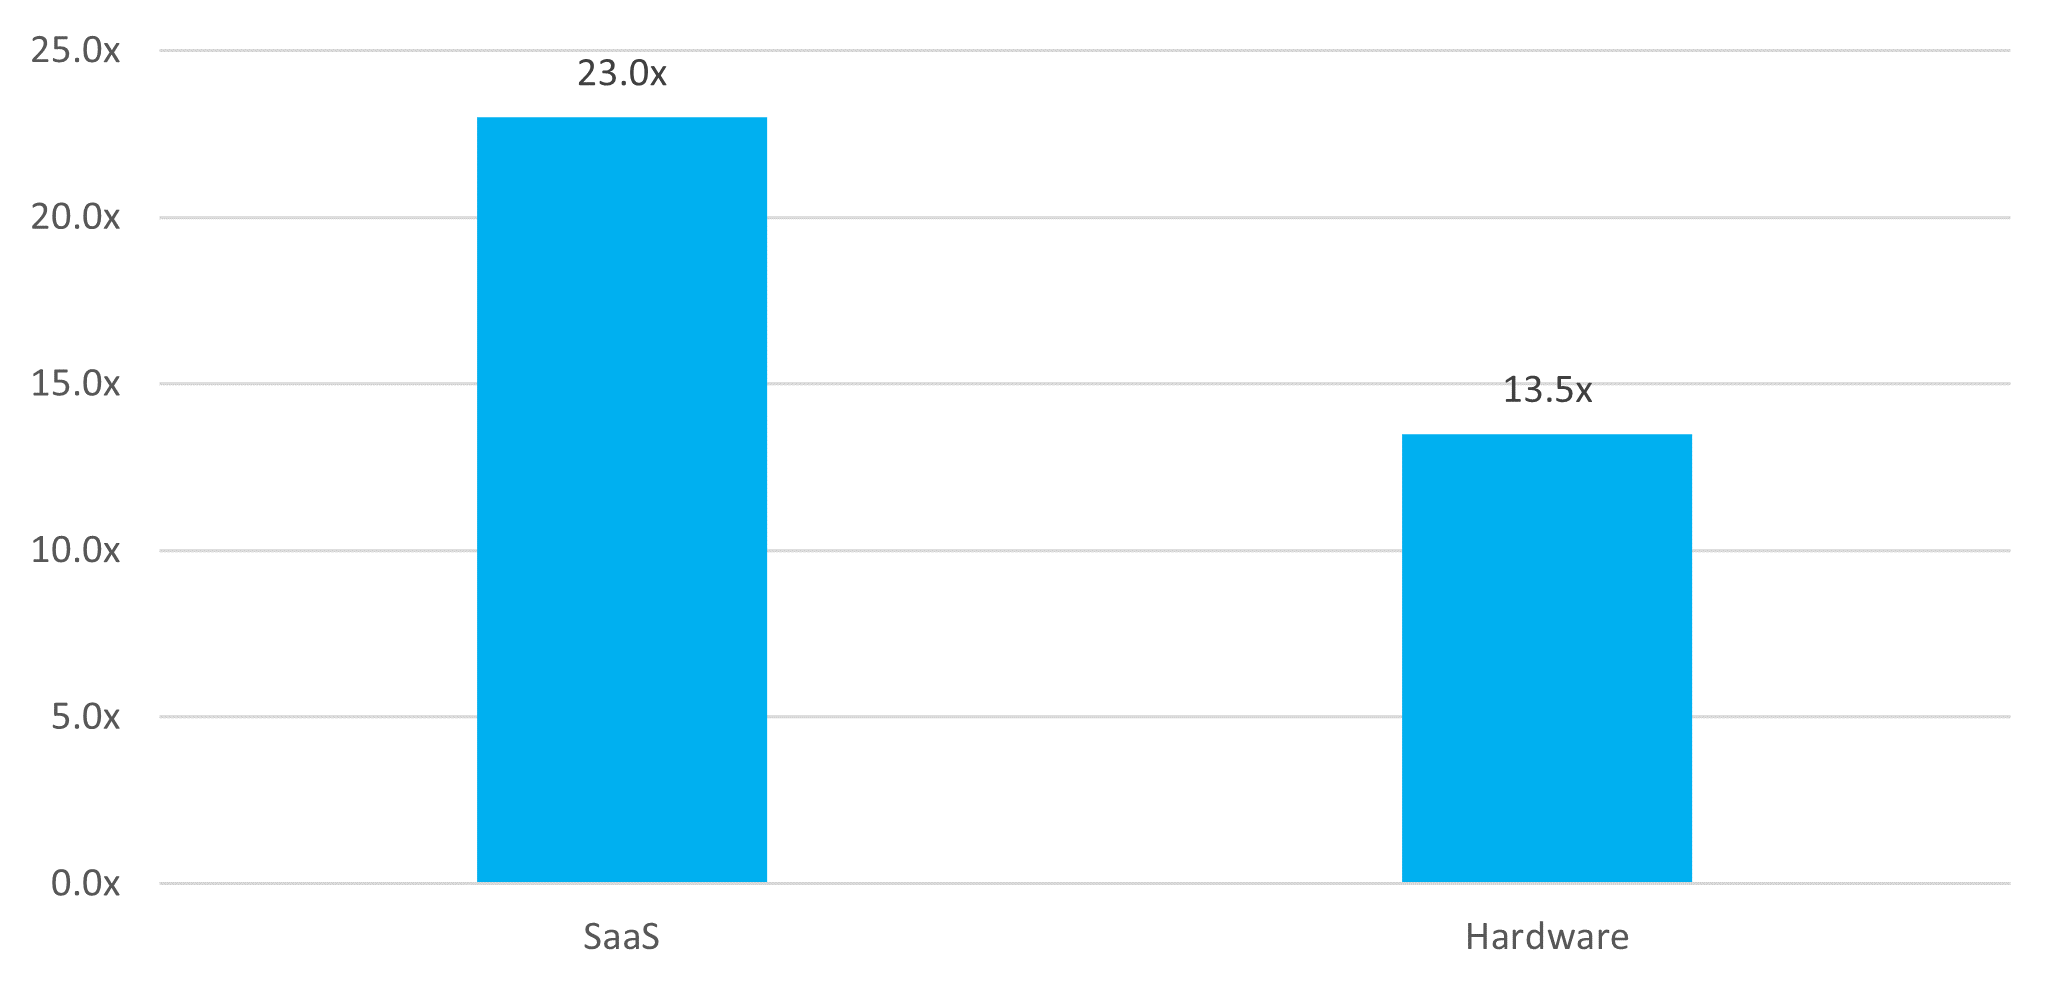
Based on M&A transactions involving UK companies from 2015 to 2021 (Source: MarktoMarket)
SaaS businesses have sold for a mean multiple of 23x since 2015, a 70% premium to Hardware companies.
I – Industry
Whilst revenue predictability may be a feature of certain sectors and does influence market multiples, other drivers come into play when assessing multiples across industries.
Different industries have different dynamics, which will impact a buyer’s perception of value. These dynamics include market size (the size of the prize), predicted growth rates (old economy versus new economy) and the competitiveness of the environment (how susceptible individual businesses are to competition and margin pressure). An industry’s quality of revenue is determined by its predictability (see above) and its source of revenue (blue-chip or small, owner-managed businesses, where credit risk may be perceived as higher).
Figure 2 demonstrates the EBITDA multiple variances between four different sectors, using samples of transactions completed in each industry: Technology (Software, Hardware, Services and Gaming); Consumer Goods; Industrials; and Construction.
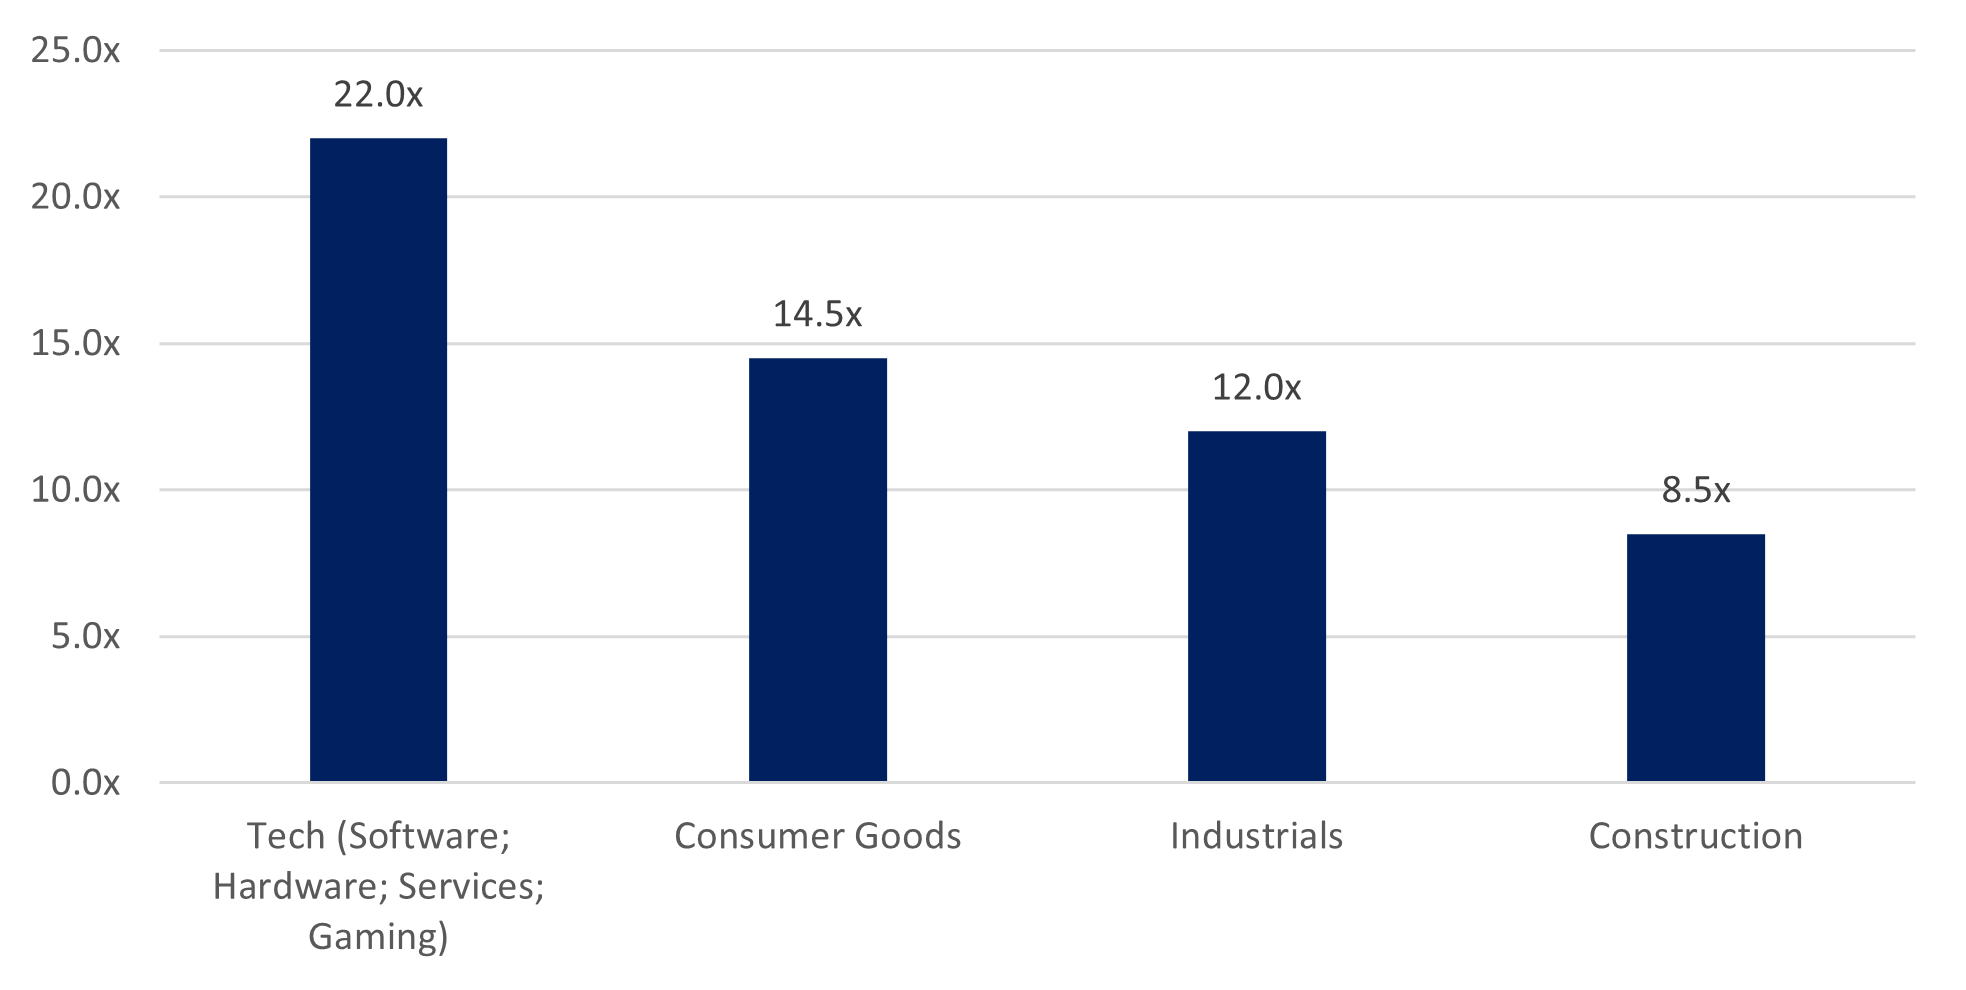
Based on sector samples of M&A transactions involving UK companies from 2015 to 2021 (Source: MarktoMarket)
G – Growth
All other things being equal, a high growth business will attract a superior multiple to a low growth business. Why? Returning to the adage that an acquirer is buying the future cash flows of a business, a growing enterprise will produce higher cash flows than a peer where trading is static.
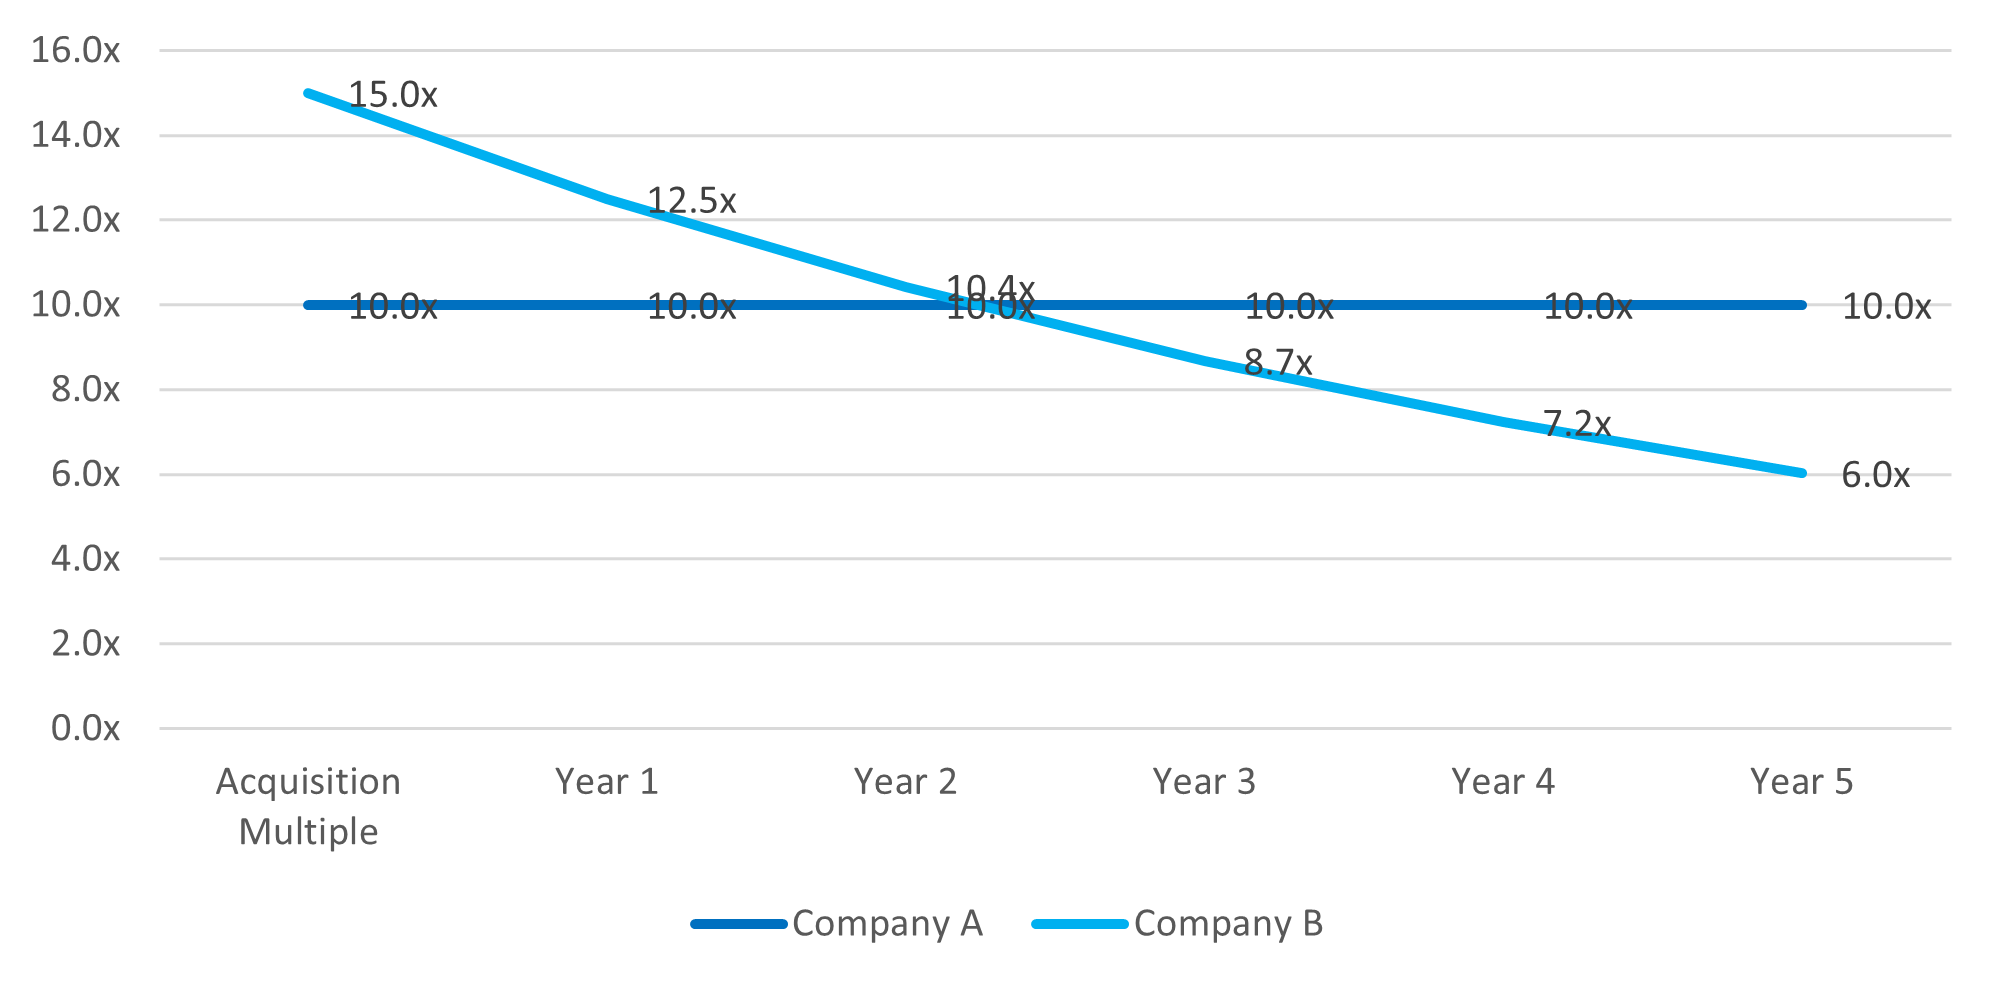
We illustrate this by mapping out EBITDA multiples over several years for hypothetical companies A and B. Company A was acquired for 10x EBITDA as its profits are predicted to remain fixed. Whereas company B is acquired for 15x EBITDA and is expected to increase its profits by 20% for the next 5 years.
As Figure 3 demonstrates, the multiple paid for Company A is always 10x as its EBITDA is stationary. With Company B, its EBITDA is growing, the effect of which is to reduce the EBITDA multiple as time elapses. The cross-over point is in year 3 – this is when Company B’s multiple becomes lower (cheaper) than Company A. Buyers will be taking a multi-year view on an acquisition target and not simply looking at its near-term performance – a seller that can make a convincing case about future organic growth will barter a higher price than a vendor with no upside story.
S – Size
A larger business should command a higher multiple than its smaller counterpart (again, assuming all other factors are equal). There is a simple, if sometimes flawed, logic to this – big companies are less risky than small companies. In general, larger organisations will be more diversified and less reliant on specific customers and product lines than smaller companies. While big businesses are not immune to collapse, the rate of business failure reduces as time elapses and size increases.
This phenomenon is evidenced in Figure 4, which depicts median EBITDA multiples for UK M&A based on deal size. We have grouped acquisition data into business value buckets to illustrate how the EBITDA multiple premiums grow with business size.
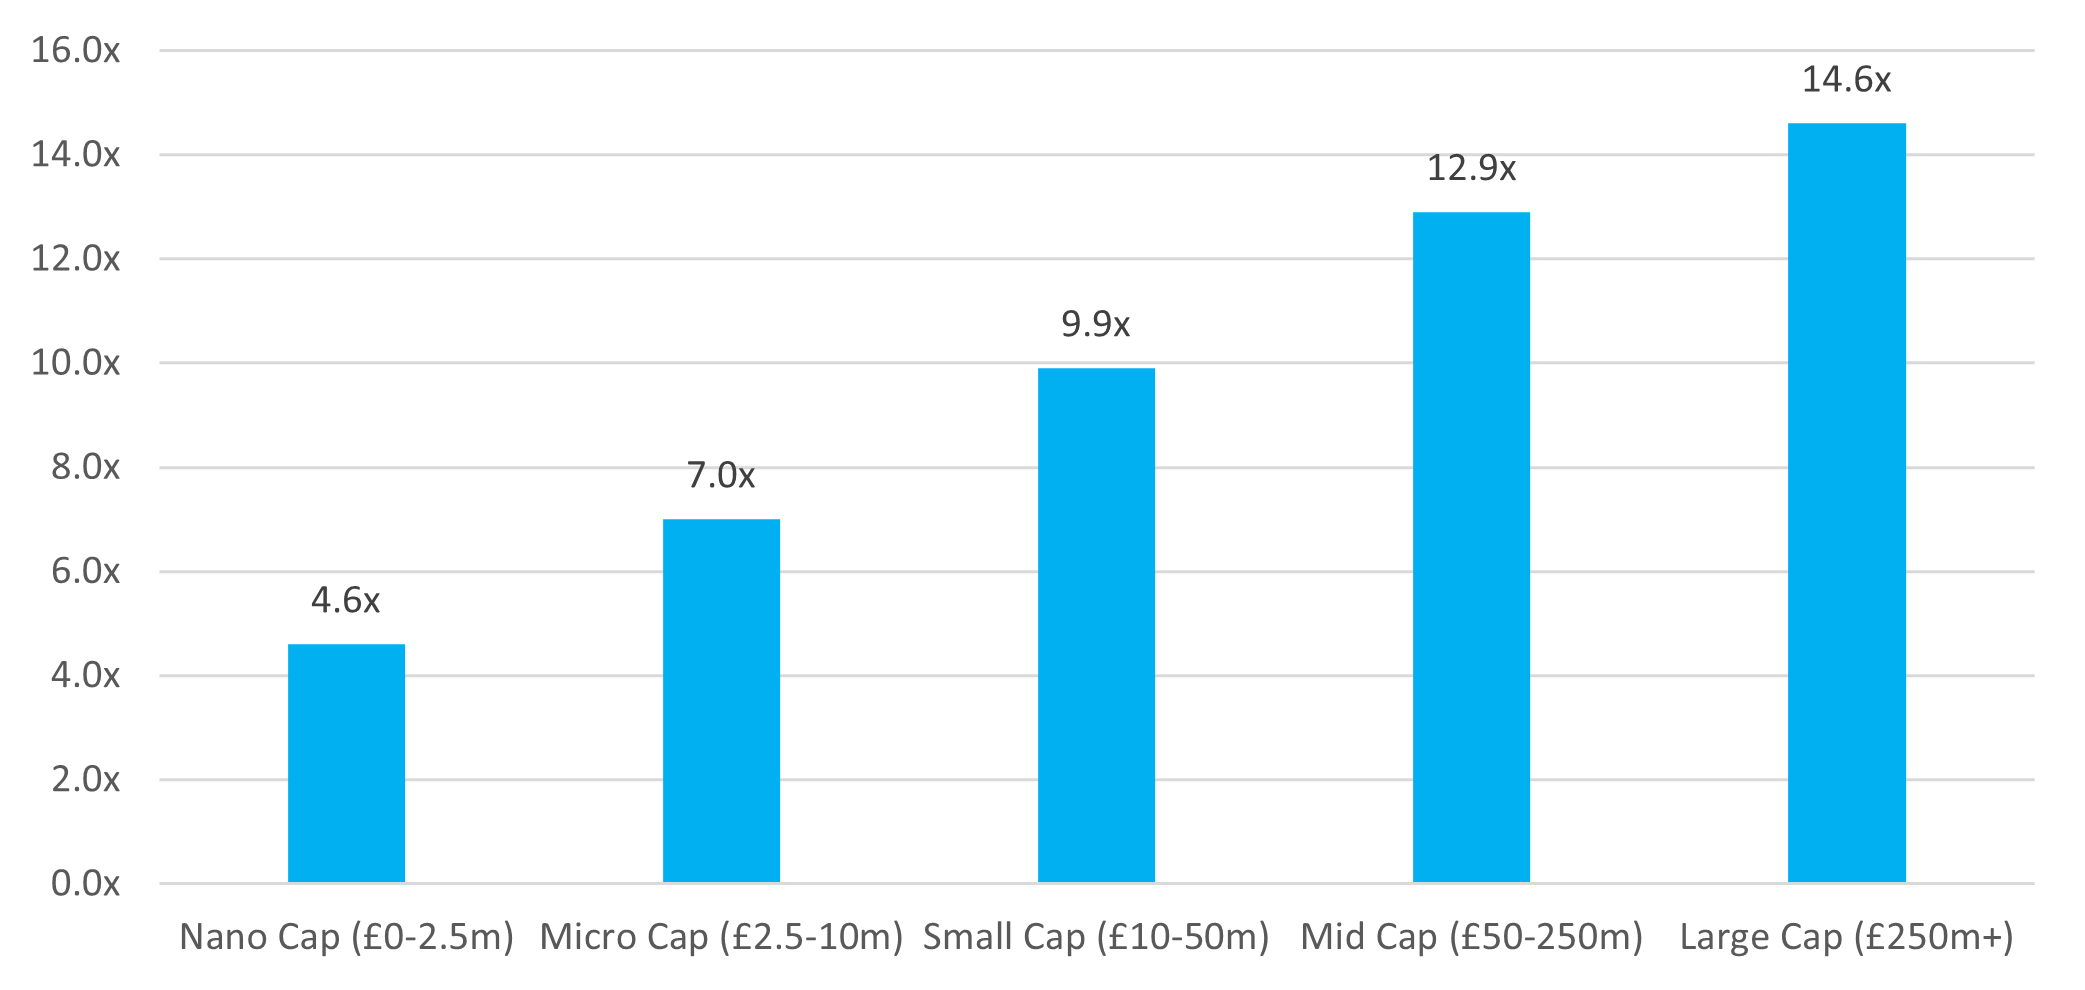
Based on M&A transactions involving UK companies in 2021 (Source: MarktoMarket)
It all matters, not just size
There are many aspects to consider when undertaking business valuation. Using “PIGS” as a reference for identifying suitable benchmark data reminds us that there are more elements than industrial operational similarities to look out for (I in “PIGS”).
Taking the quantified data from industry analysis on comparable transactions in businesses with similar revenue models (predictability), and overlaying this with those with equivalent growth rates and sizes is crucial when it comes to business valuation.
MarktoMarket
Using MarktoMarket’s data platform, you can ensure you are selecting the right multiples to gain the best insight into business valuation. MarktoMarket’s auditable data gives users the confidence that they are dealing with intelligence that can be trusted.
Our gold standard deal database gives you a comprehensive picture of UK M&A for faster, more informed decision making and better outcomes.
For more details contact nick.webb@marktomarket.io