MarktoMarket Analysis: Series A and B Revenue Multiples (2023 vs 2022)
Much hand-wringing has occurred over the contraction in valuations in startups. We are seeing limited evidence of this at earlier stages, perhaps due to the lack of correlation between pricing and business fundamentals – if a business is pre-revenue or very early in its revenue journey, multiples are meaningless. However, once a company reaches Series A stage, it is likely to have demonstrated product market fit and crossed some revenue milestones. As such, and whether or not the investor used a multiple to value the business, we can study the correlation between revenue and valuation.
We analysed a cohort of Series A+ fundraises in 2023 (the “2023 cohort”) and compared revenue multiples with a cohort of Series A+ investment rounds in 2022 (the “2022 cohort”). We defined Series A+ as any round of funding in a UK startup of greater than £3 million where we could capture adequate information.
2023 V 2022
Our 2023 cohort consists of 52 companies versus 137 businesses in the 2022 cohort. The headline figure implies a significant contraction in revenue multiples in 2023 versus 2022. The median (excluding outliers) revenue multiple in the 2023 cohort was 6.9x versus 10.0x in the 2022 cohort, when calculated on pre-money valuation. Using post-money valuation as the numerator increases these multiples to 9.5x (2023) and 12.8x (2022).
These multiples are based on historic trading. On the basis that our cohorts are growing, this will overstate multiples on a real-time or forward-looking basis – a higher revenue figure will translate into a lower revenue multiple.

Growth Adjustment?
Our 2022 cohort grew revenues at a median rate of 40%, when comparing results in the year of the raise versus the preceding year. For companies with a December year end this will be December 2022 figures relative to December 2021 results. We don’t have 2023 trading figures for our 2023 cohort but the growth rate of this group over the same period (ie 2022 v 2021) was 50%.
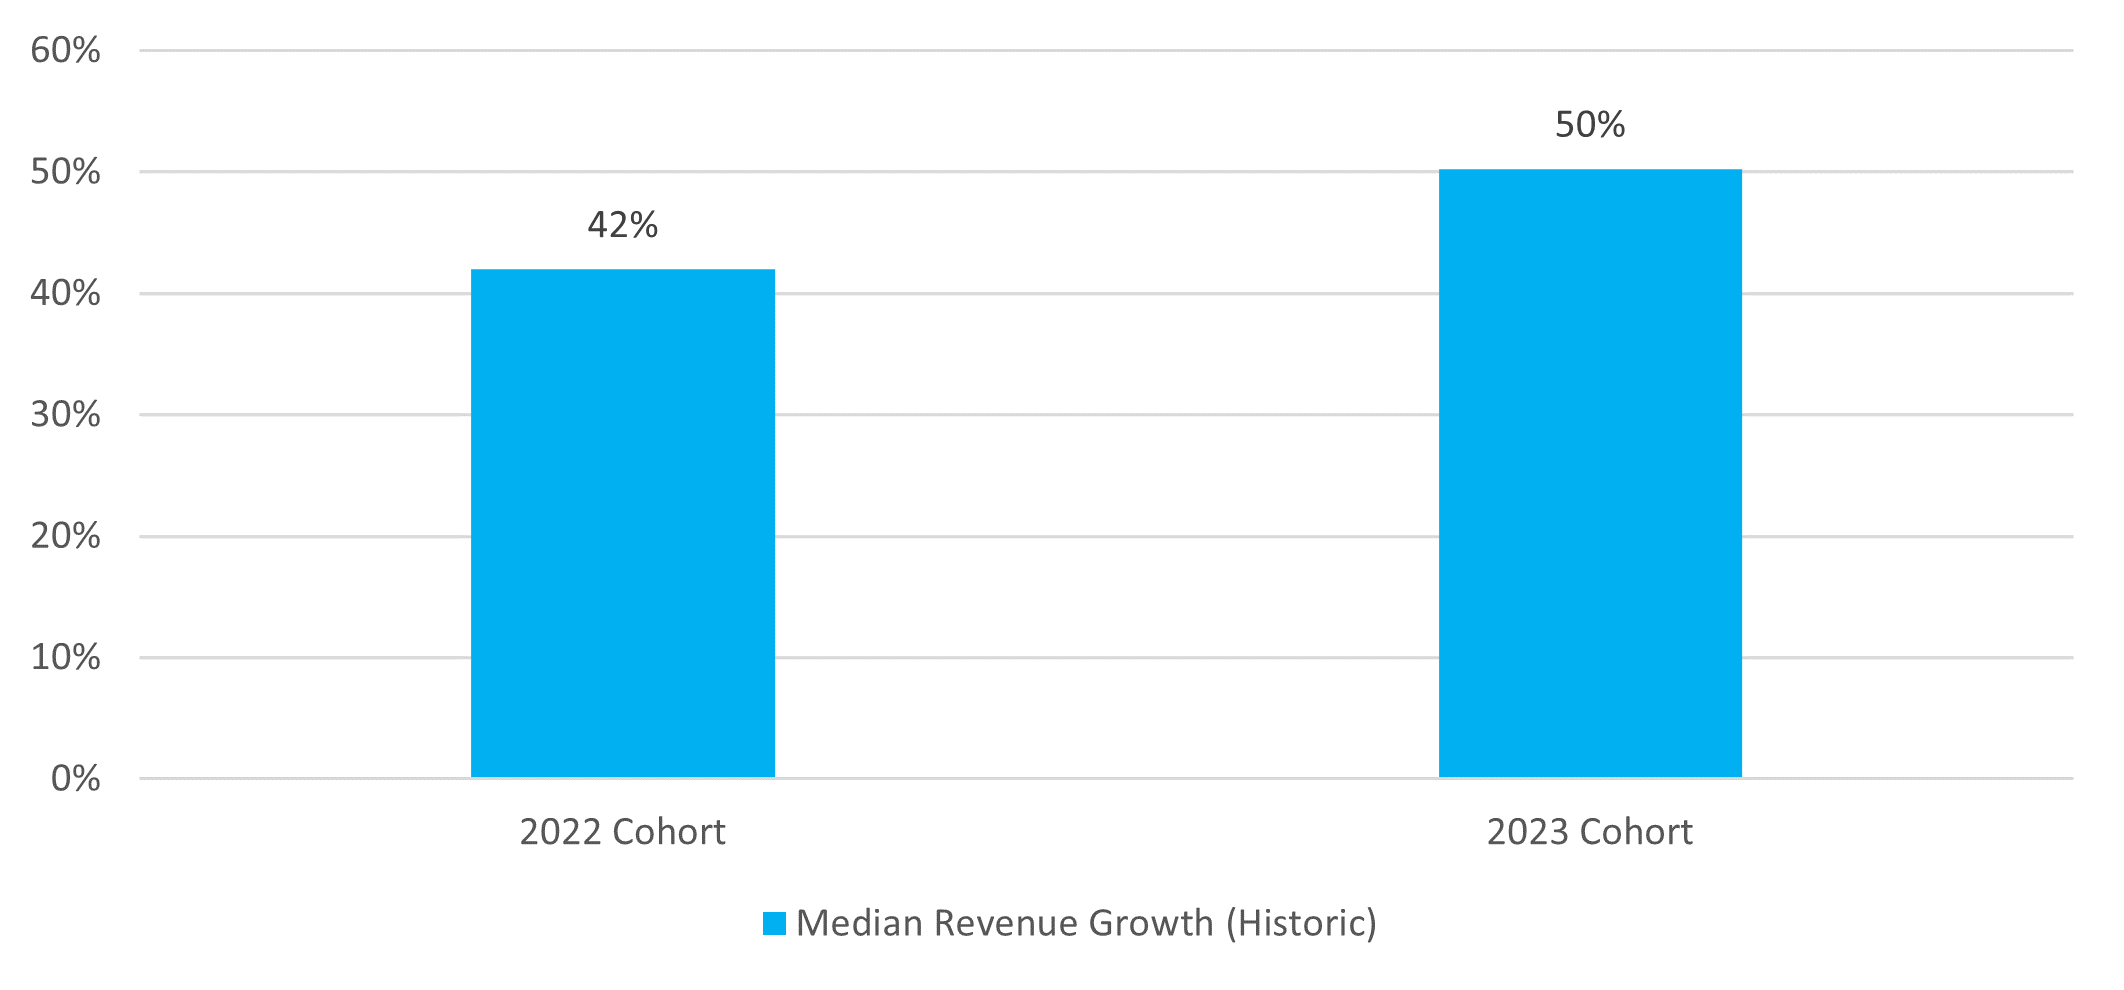
If you assume a consistent growth rate into 2023 (50%), the pre-money/revenue multiple for the 2023 cohort contracts to 4.3x and the post-money multiple falls to 6.3x.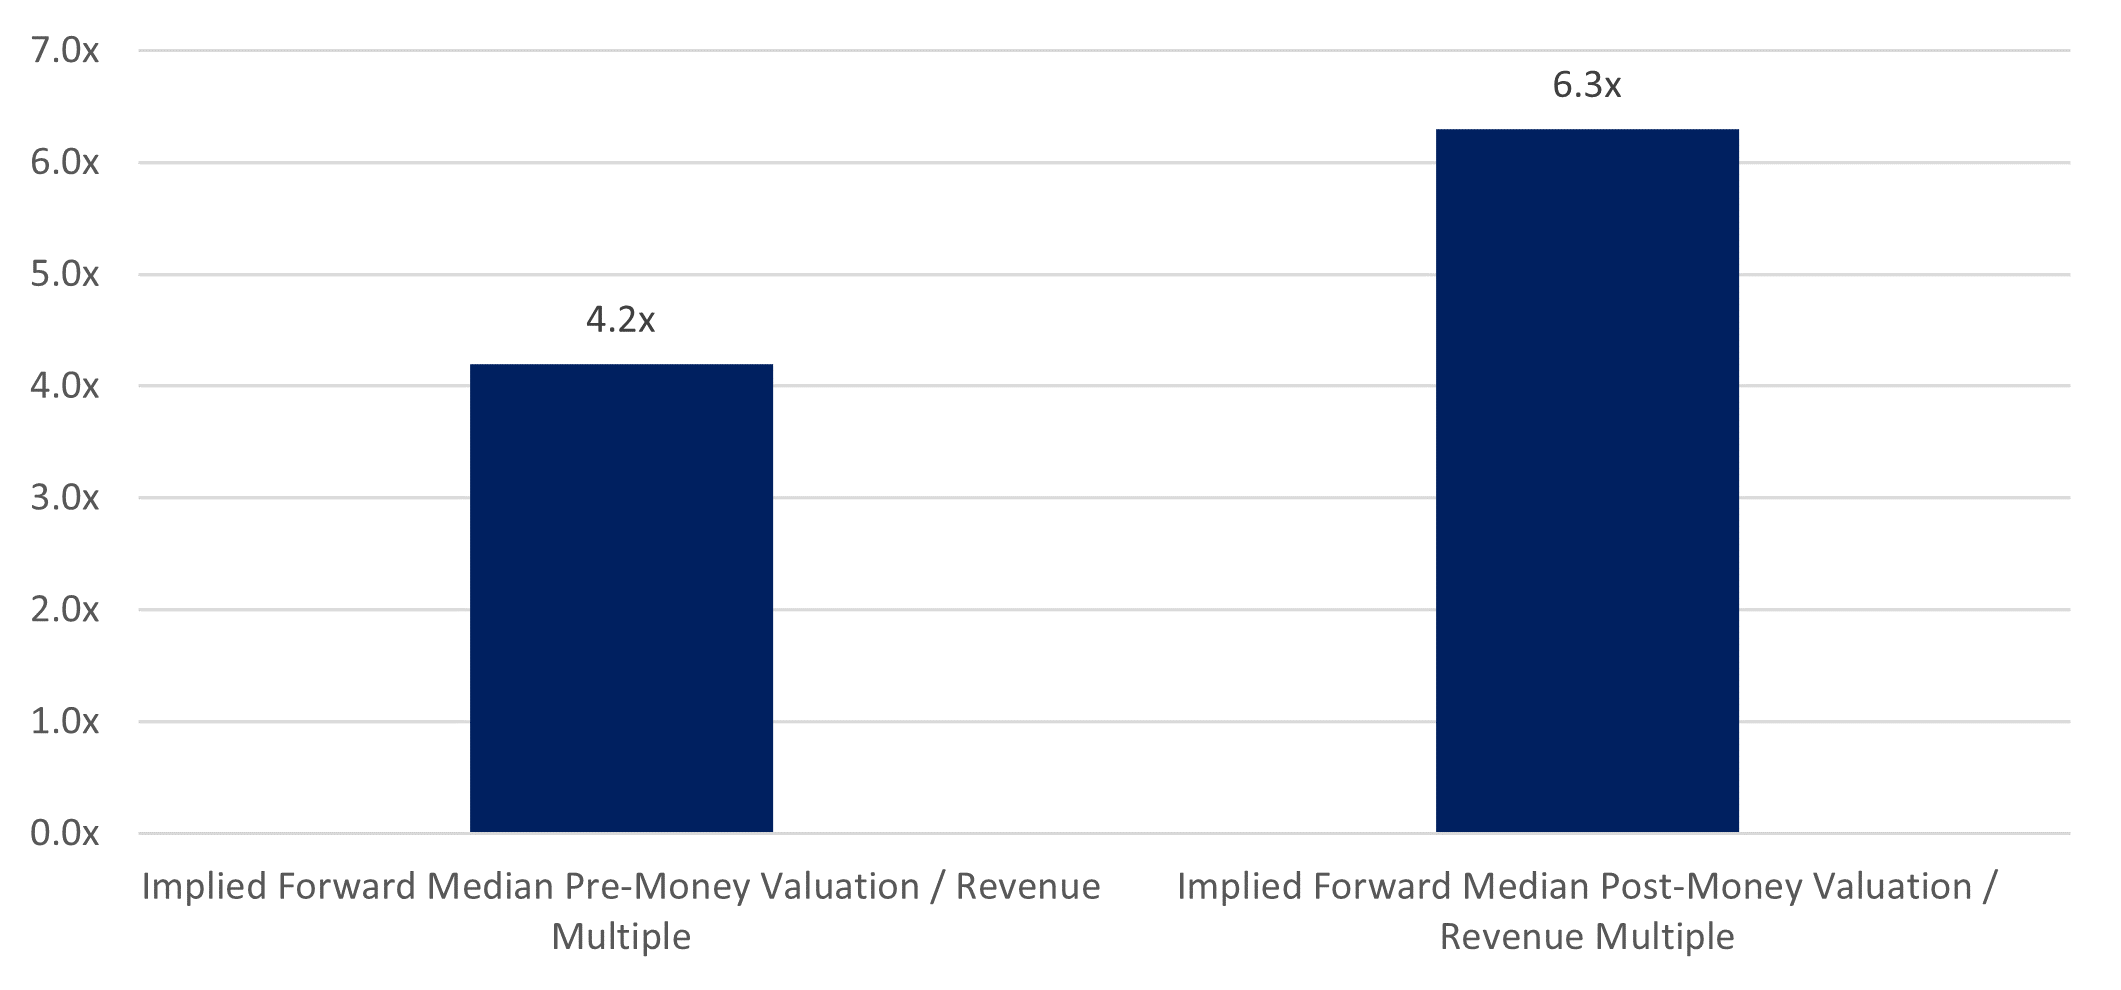
Price V Growth
The correlation between valuation multiples and growth rates is well understood. Companies with high earnings growth should merit a higher EBITDA multiple that similar businesses with slow or no growth. Whilst our cohorts of startups are loss-making and, therefore, have no earnings to multiply, we can analyse revenue growth versus revenue multiples.
The chart below plots both cohorts to show the relationship between revenue growth and revenue multiple. The regression line illustrates how multiples expand as growth increases.

Methodology
A health warning – companies were included in our sample based on whether we believed we had adequate information on their valuation and trading results. Information at this end of the market is usually incomplete and, as such, there is an element of judgement used to complete the picture.
All multiples are calculated as median excluding outliers, defined as a revenue multiple of less than 1x or more than 50x.
Last Twelve Month (“LTM”) revenue figures were selected for the 2023 cohort as these results are most likely to represent 2022 trading; LTM-1 revenue figures were selected for the 2022 cohort as these are likely to be 2021 trading. This broadly aligns each data set to historic Pre-Money Valuation/Revenue multiples.
MARKTOMARKET
MarktoMarket is the most comprehensive data platform for the analysis of SMEs and startups. Our rich, auditable database of corporate information is used by thousands of the UK’s accountants, advisers and investors.
Please click here to find out more