IPO Premium – What Is The Uplift At Float?
IPO PRICING
Pricing a company at an initial public offering (IPO) usually defaults to a discount to a peer group of similar companies that are already listed. If this basket of “comps” is valued at an average multiple of 15x forward earnings, the issuing broker will discount from this, and hope the fund managers agree.
However, what happens when there is no basket of comparable companies and the listing company is not profitable? How do you price these raises? For many IPOs, especially in tech and biotech, there will be previous rounds that can be used as reference points for valuation. Assuming the previous rounds were arm’s length deals with third parties, potential investors can build a premium (or discount) on top of the last round price based on progress and milestones achieved since this date. The value of the listing can also be incorporated as, all other things being equal, a listed business is worth more than an unlisted business due to the liquidity premium (it’s easier to sell your shares in a public company than a private company).
NO FUNDAMENTALS
To analyse the premium we dived into IPOs over the past three years and compared company share prices at listing to the last round prior to listing.
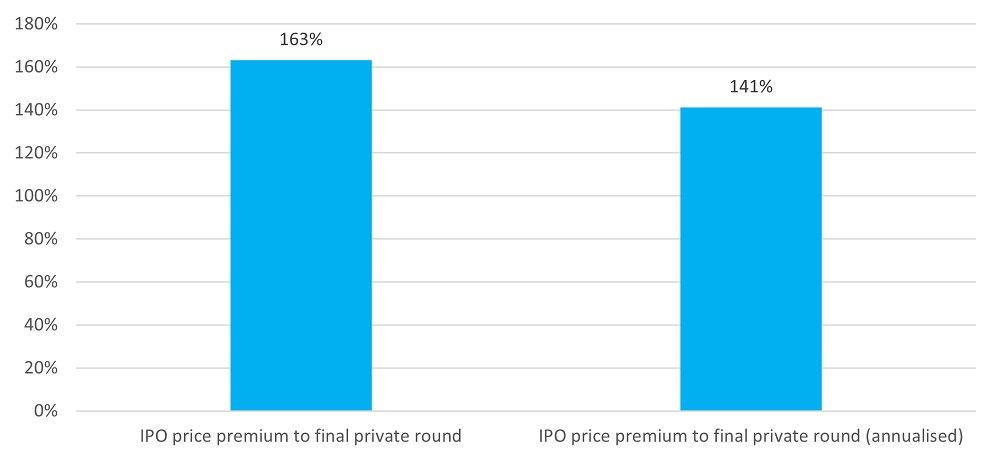
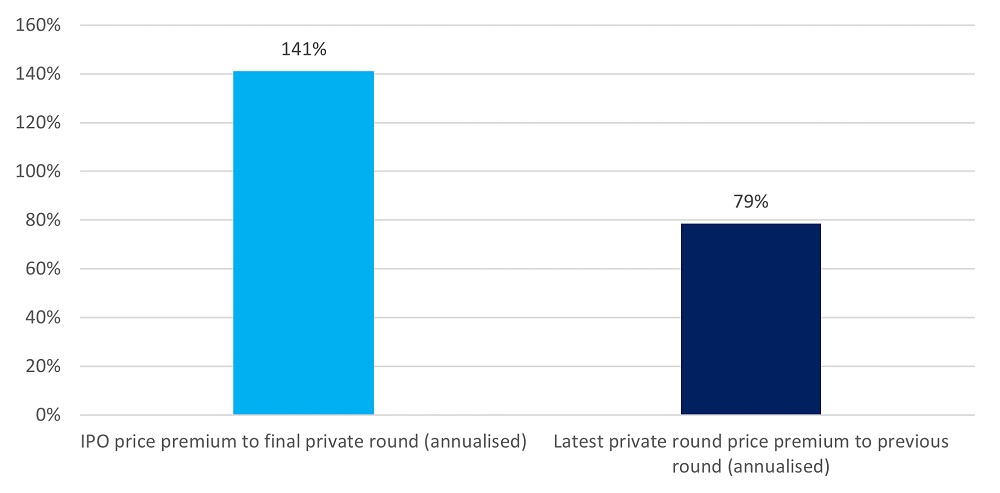
As Figure 1 illustrates, the median price premium on IPO (relative to each listing company’s last private round price) was 163%. Given the lack of consistency between the time period separating each company’s last private round and IPO, we annualised the premium. The median annualised premium was 141%.
To understand whether there is a correlation between premium and time between the last round and IPO, we produced the chart at Figure 2.
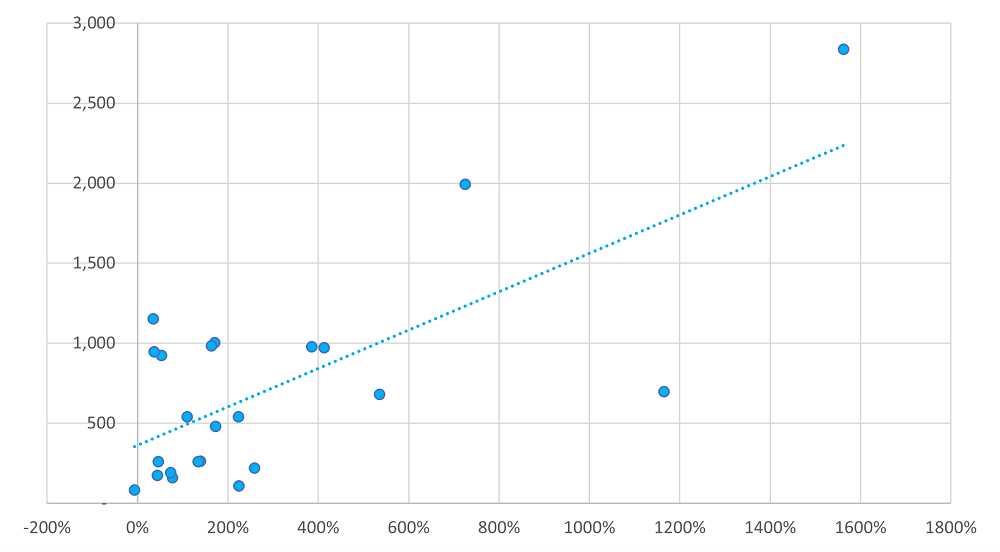
The chart shows a clear correlation between time (vertical axis) and IPO premium (horizontal axis). Outliers include Abingdon Health, which achieved a 1,165% IPO premium over its prior round, despite this being less than 2 years prior to its listing. Lendinvest could only manage a 35% premium despite its last round prior to IPO completing over 3 years previously.
WOULD PRIVATE MARKETS APPLY THE SAME PREMIUM?
Is the premium at IPO greater than the company would achieve if it were to continue its capital raising activities in the private markets? This is a difficult question but we can try to answer it by selecting a basket of proxy companies (our “non-IPO” sample) with similar characteristics to our sample that chose the IPO route.
Our non-IPO sample median capital raise is £14m (guided by the median capital raise of £17 million by our IPO sample); the median time between the component companies’ most recent raise and their previous raise is 550 days (guided by the median time between IPO and prior round of 541 days by our IPO sample).
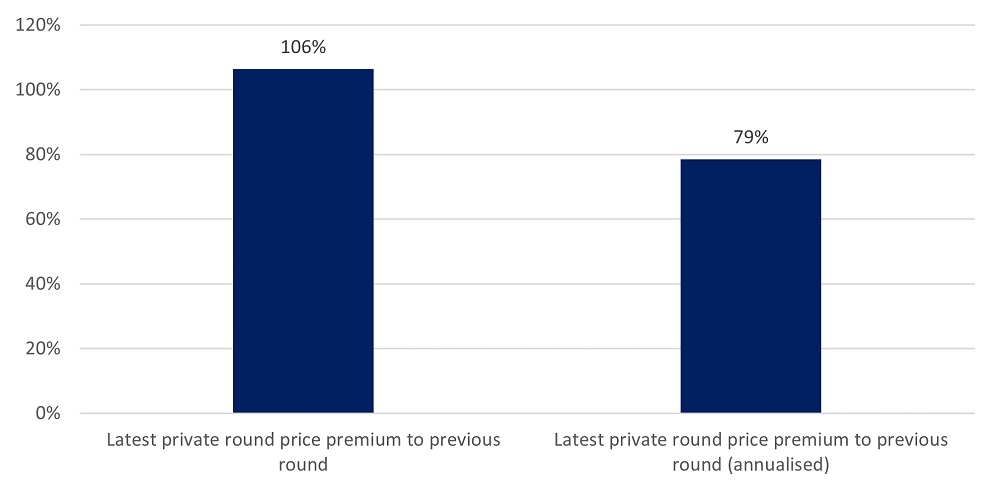
The non-IPO sample price premium is materially lower than the IPO sample premium. The fairest proxy is the annualised figure which we record at 79% for the non-IPO sample versus 141% for the IPO sample.
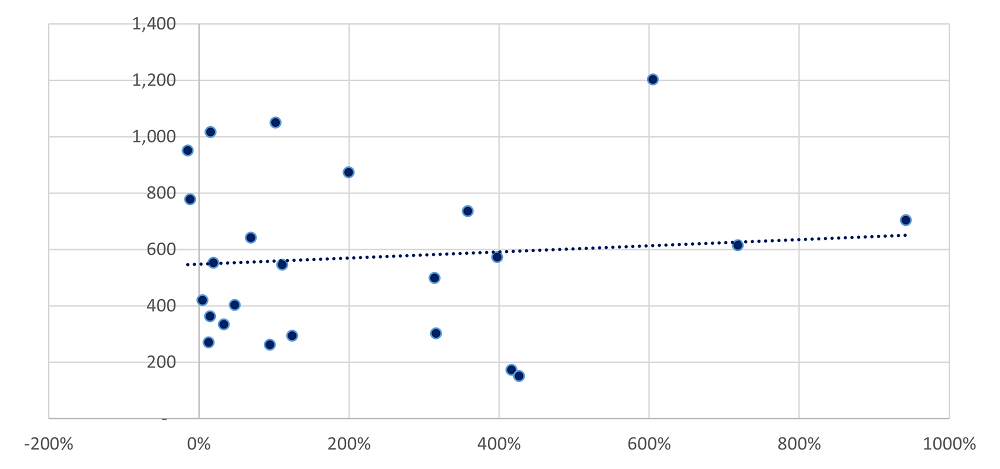
There is a noticeably weaker correlation between the time elapsed from the previous and latest round (vertical axis) and the non-IPO premium (horizontal axis).
what does this tell us?
Based on our samples, it implies that public markets are willing to apply a far bigger premium to the last round price than private markets.
It suggests that there is a combination of a greater willingness to ignore the last round price (or be more generous in the appraisal of progress since the last round) and to recognise the value of a listing (liquidity and transparency).
Of course, this premium may also be led by the lack of transparency over private round pricing and, therefore, little anchoring to these earlier prices. Regardless, it is food for thought….are investors paying over the odds for earlier-stage tech and biotech companies at IPO?
All data from MarktoMarket and London Stock Exchange
MARKTOMARKET
MarktoMarket collects rich data on every equity fundraising event (announced and unannounced) in the UK. Our easily searchable database allows our advisory and venture capital customers to identify, analyse and price investments. MarktoMarket’s auditable data gives users the confidence that they are dealing with intelligence that can be trusted.
To continue the discussions about how data can support your business, contact Doug Lawson.