Financial Data & Software Valuations
This article looks at the valuation of financial data and software companies through surfacing previous deals, with deeper commentary on sub-sectors of Fintech; software for accountants, financial market software, and financial market data.
Defining the niche
Fintech’ is a broad church but most definitions would include software that performs and records financial transactions as well as data platforms that aggregate financial information. Both of these areas have been popular with private equity and PE-backed trade buyers.
In the ‘software for accountants’ niche, IRIS is the gorilla with 37 deals completed. This platform shows little sign of slowing down following a secondary buyout by Leonard Green & Partners in the US. In the broader financial markets software arena, the buyer pool is more fragmented but some familiar names keep appearing – Thoma Bravo, Nasdaq Inc, Deutsche Borse and FNZ have all completed material deals in the last 12 months.
In the data space, there has been steady activity, particularly in the private markets. As capital continue to flow to private assets, investors continue to demand ever-more sophisticated ‘picks and shovels’ to analyse these opaque markets. A standout deal was MSCI’s $1 billion acquisition of The Burgiss Group. The 12x revenue multiple illustrates the value of proprietary datasets.
We segmented financial data and software into three sub-sectors to analyse multiples:
- Software for Accountants
- Financial Markets Software
- Financial Markets Data
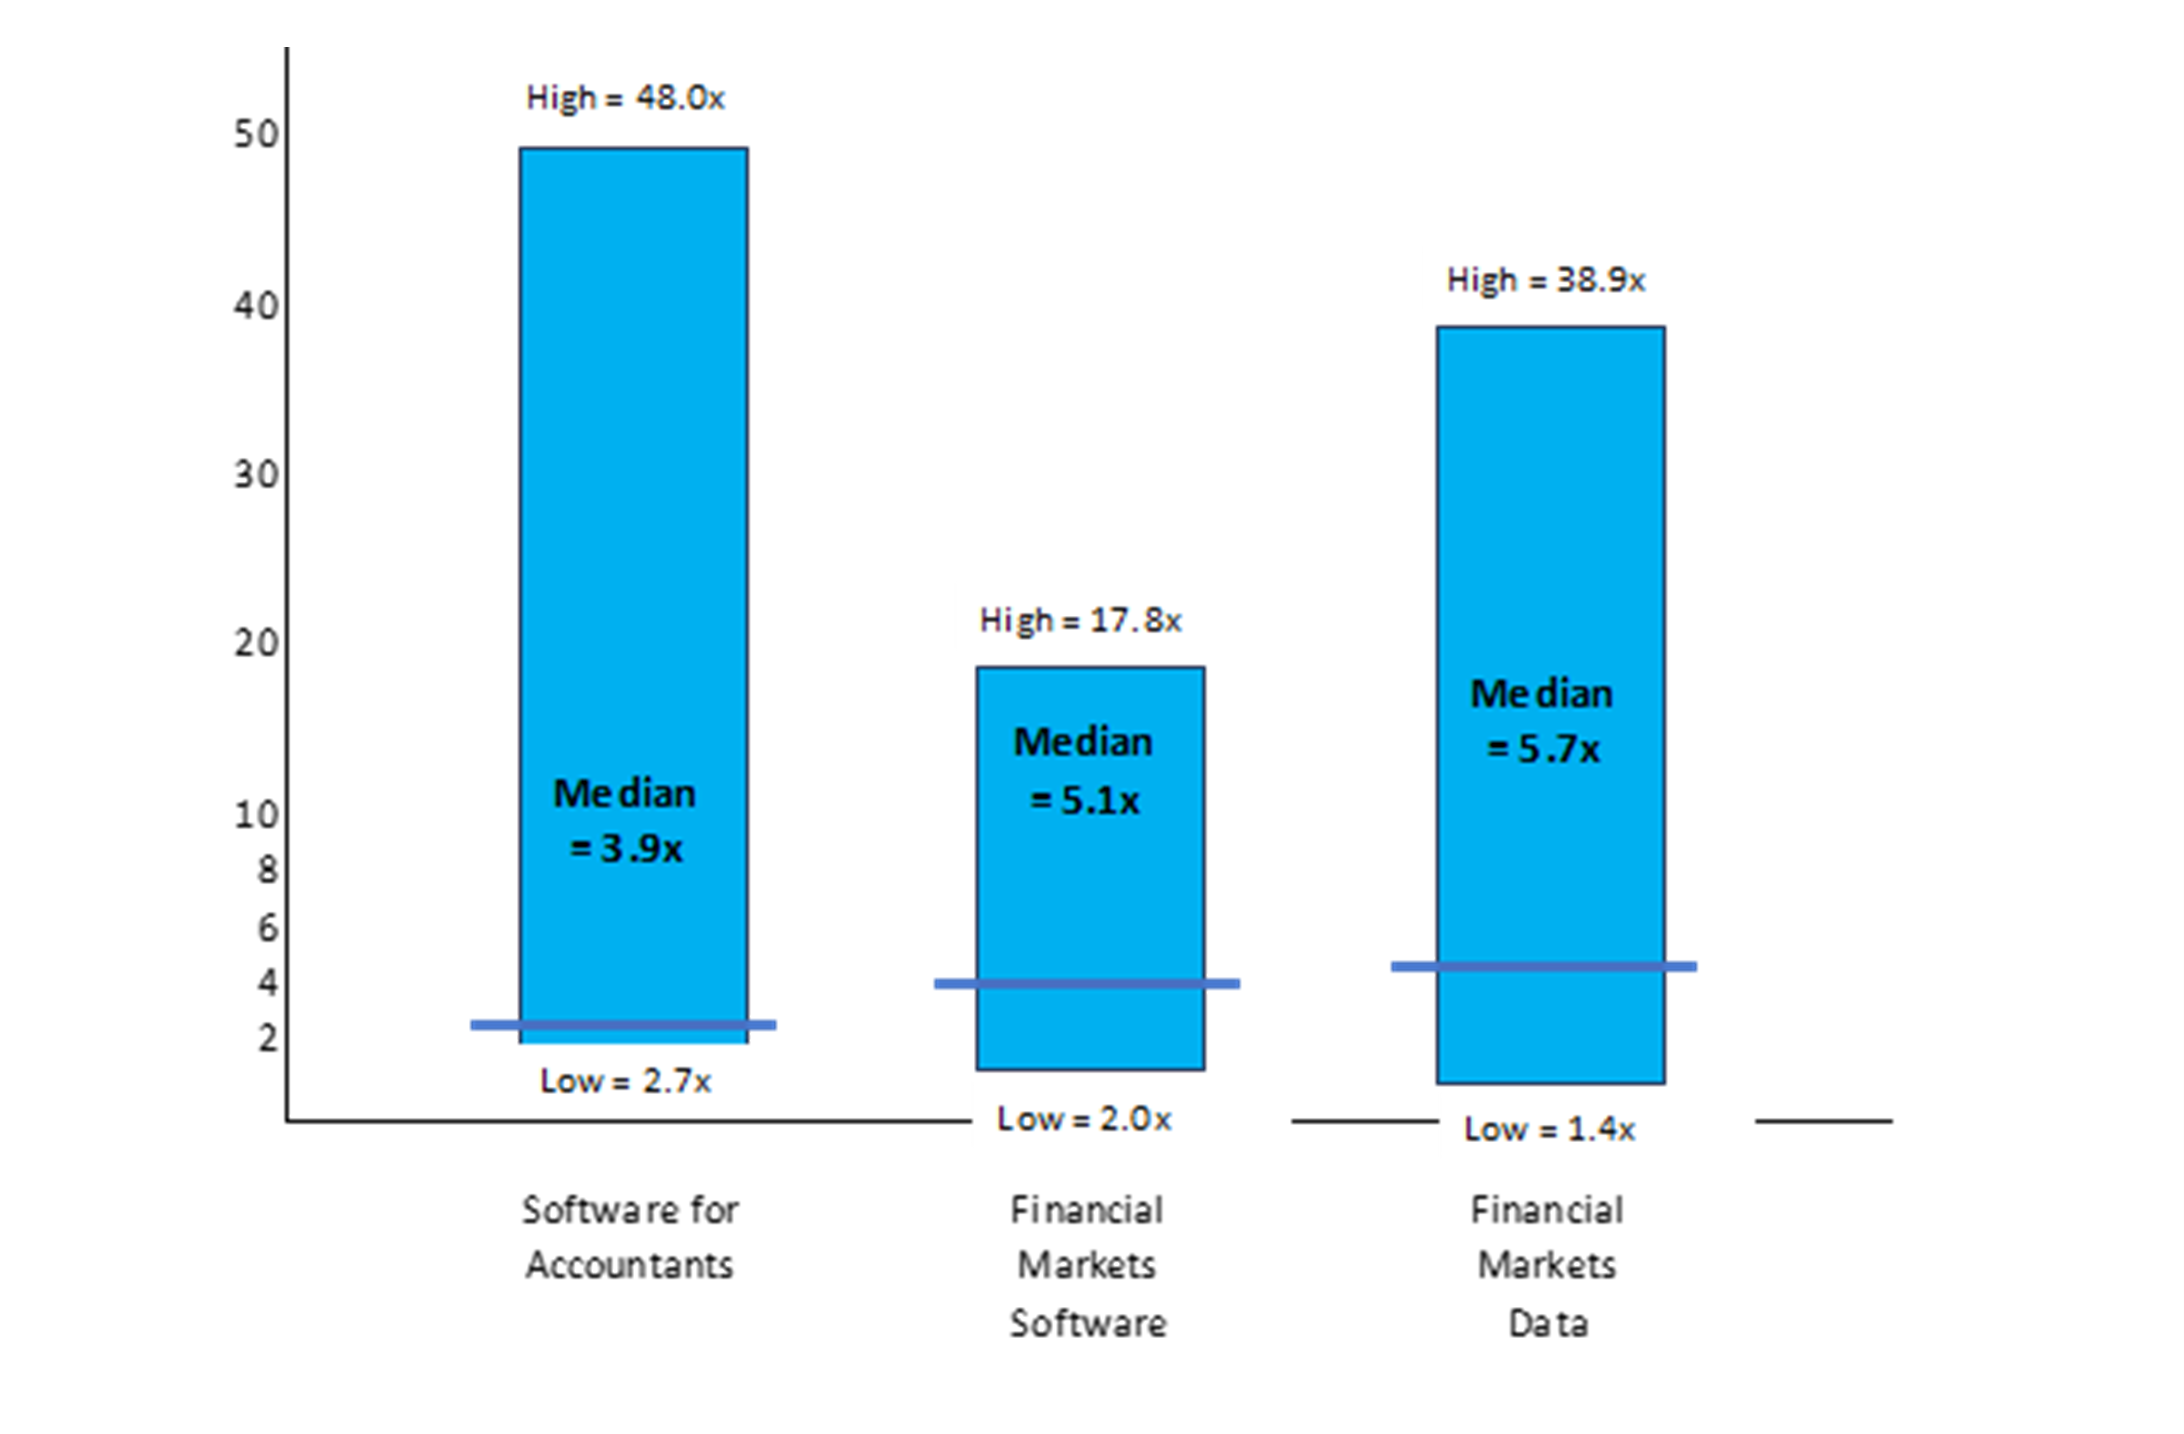
Most of the outliers on the upside can be attributed to low (or even sub) single digit revenue businesses that are growing rapidly. However, double digit multiples are not uncommon, especially in the data space.
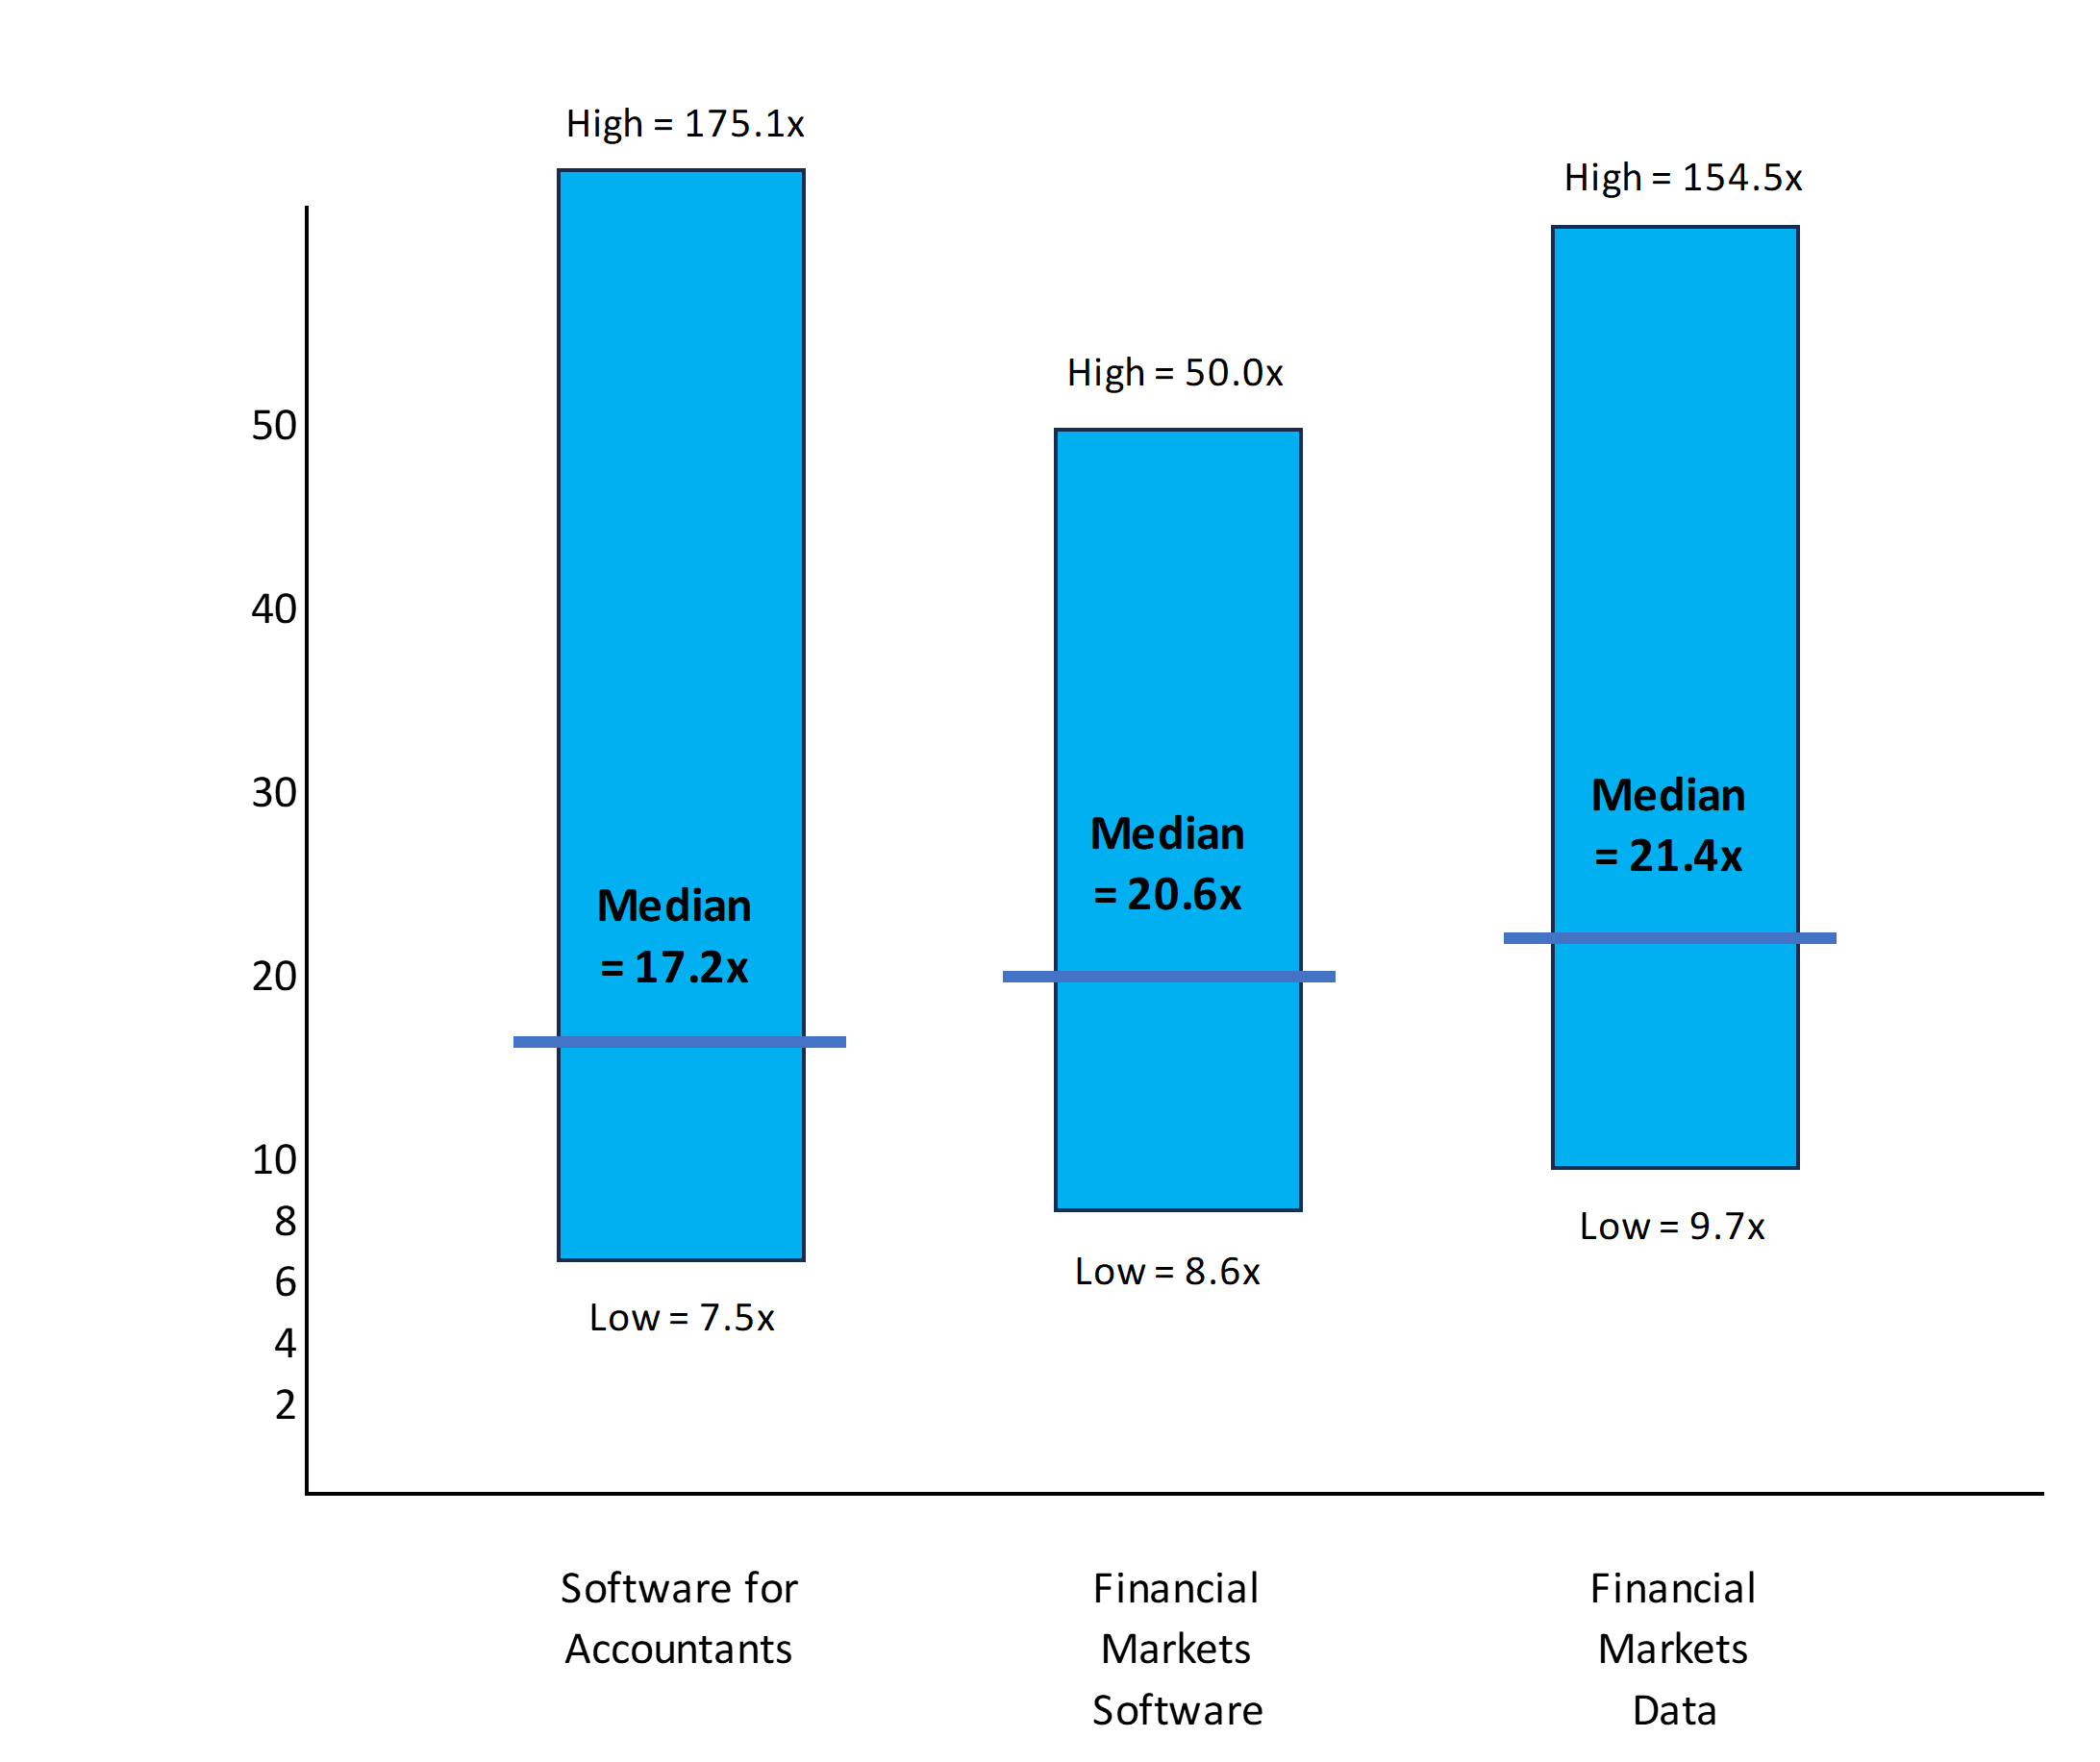
Very few deals transacted at EBITDA multiples under 10x. Most deals were priced at ‘high-teens’ multiples and above. This makes sense in the context of elevated revenue multiples and high EBITDA margins that are characteristic of the sector, especially (sorry to say it again) within data. The median EBITDA multiple of the entire sample (excluding loss-makers) was 29%.
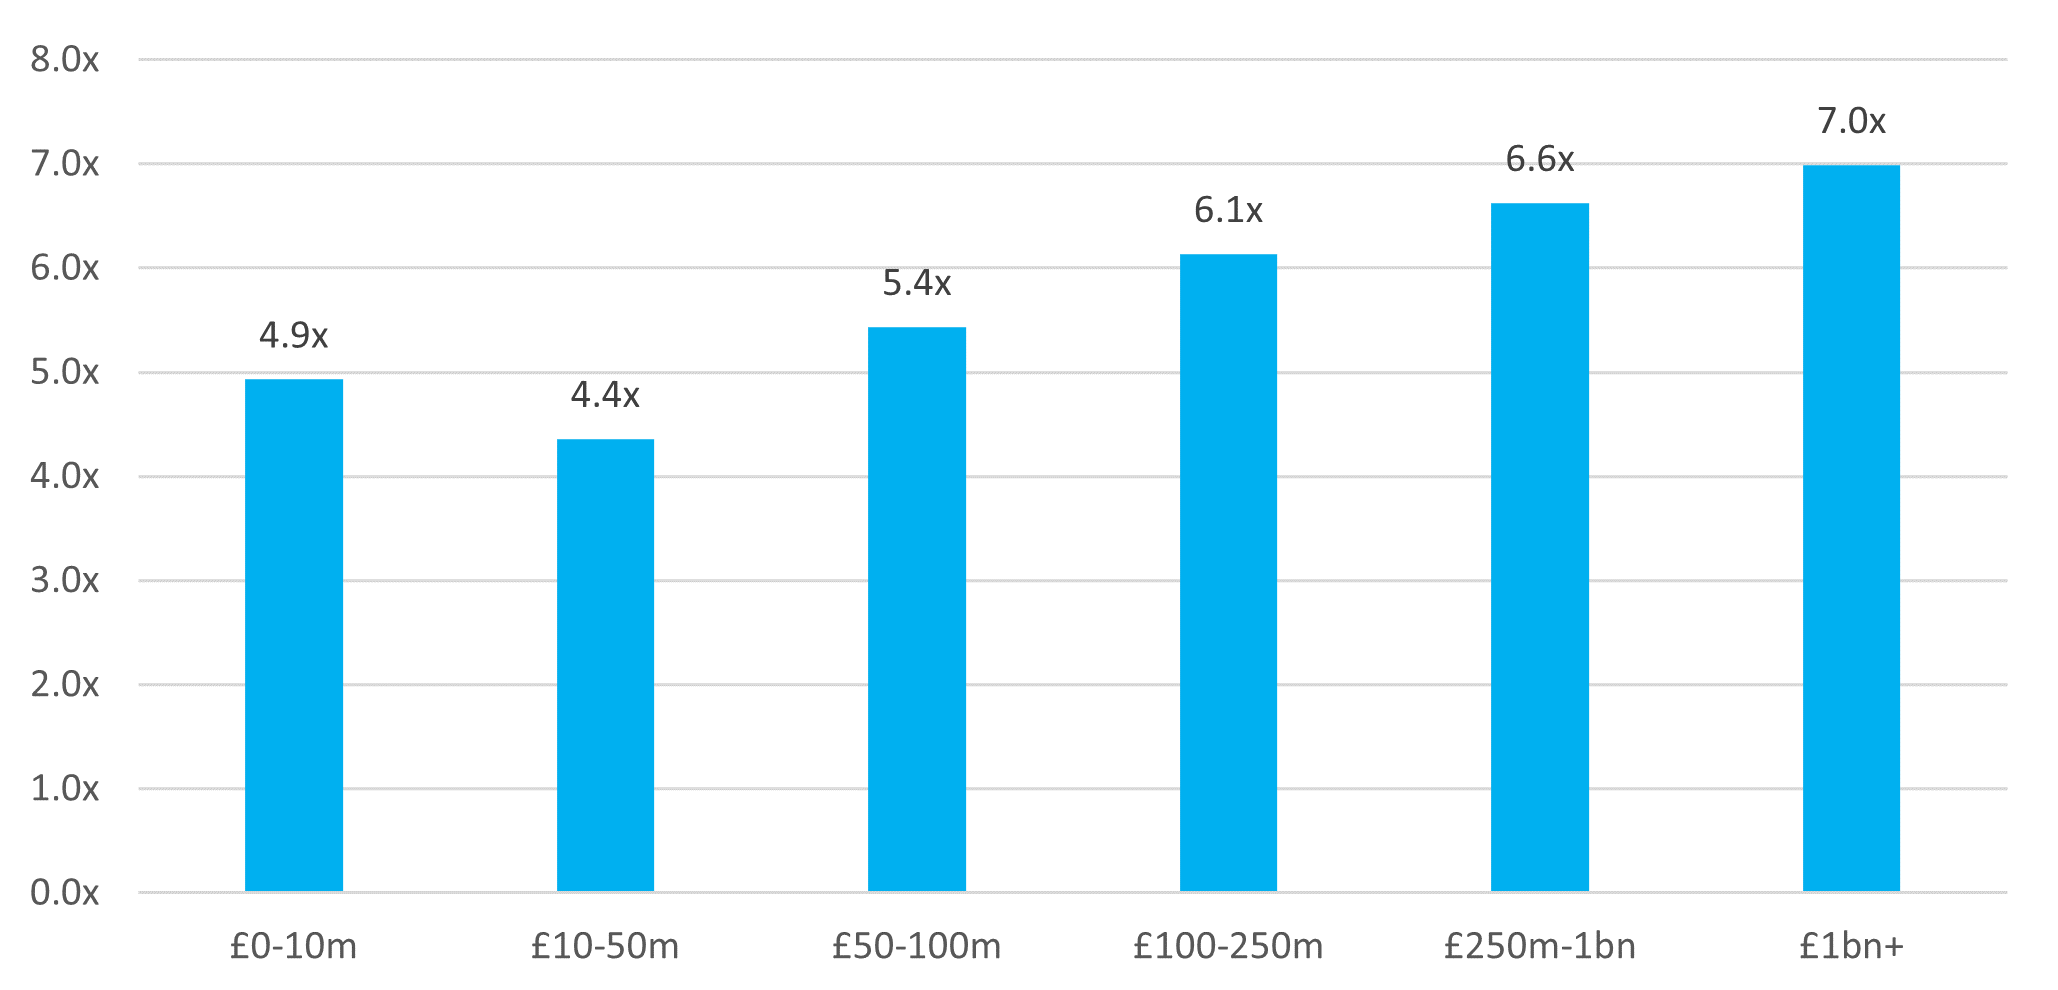
Multiples do appear to be influenced by size, albeit with an aberration in the £10-50 million EV range. We believe this is a sample, not market, phenomenon. The attraction of higher growth within the smaller businesses is offset by lower perceived risk in the larger businesses.
MARKTOMARKET
MarktoMarket is the most comprehensive data platform for the analysis of SMEs and startups. Our rich, auditable database of corporate information is used by thousands of the UK’s accountants, advisers and investors.
Please click here to find out more
Users of this data assume full responsibility for any references to the MtM Indices and conclusions drawn from any usage. MarktoMarket has no liability for any damage caused by errors or omissions in any information