UK M&A Valuation Indices H1 2020
REPORT HIGHLIGHTS
Highlights from our latest UK M&A Valuation Indices H1 report, covering deals and valuation multiples in UK M&A for the first half of 2020. Download the executive report below.
There has been much conjecture over the direction of travel of multiples as a consequence of the COVID-19 pandemic. Our data suggest that multiples paid in the first half of 2020 held-up reasonably well relative to 2019. The mean EV/EBITDA multiple in H1 2020 was 8.9x versus 9.1x in 2019, a fall of just 2%. Furthermore, splitting the data into the first and second quarter (a very rough proxy for pre and post-COVID pricing) shows little variance in multiples paid.
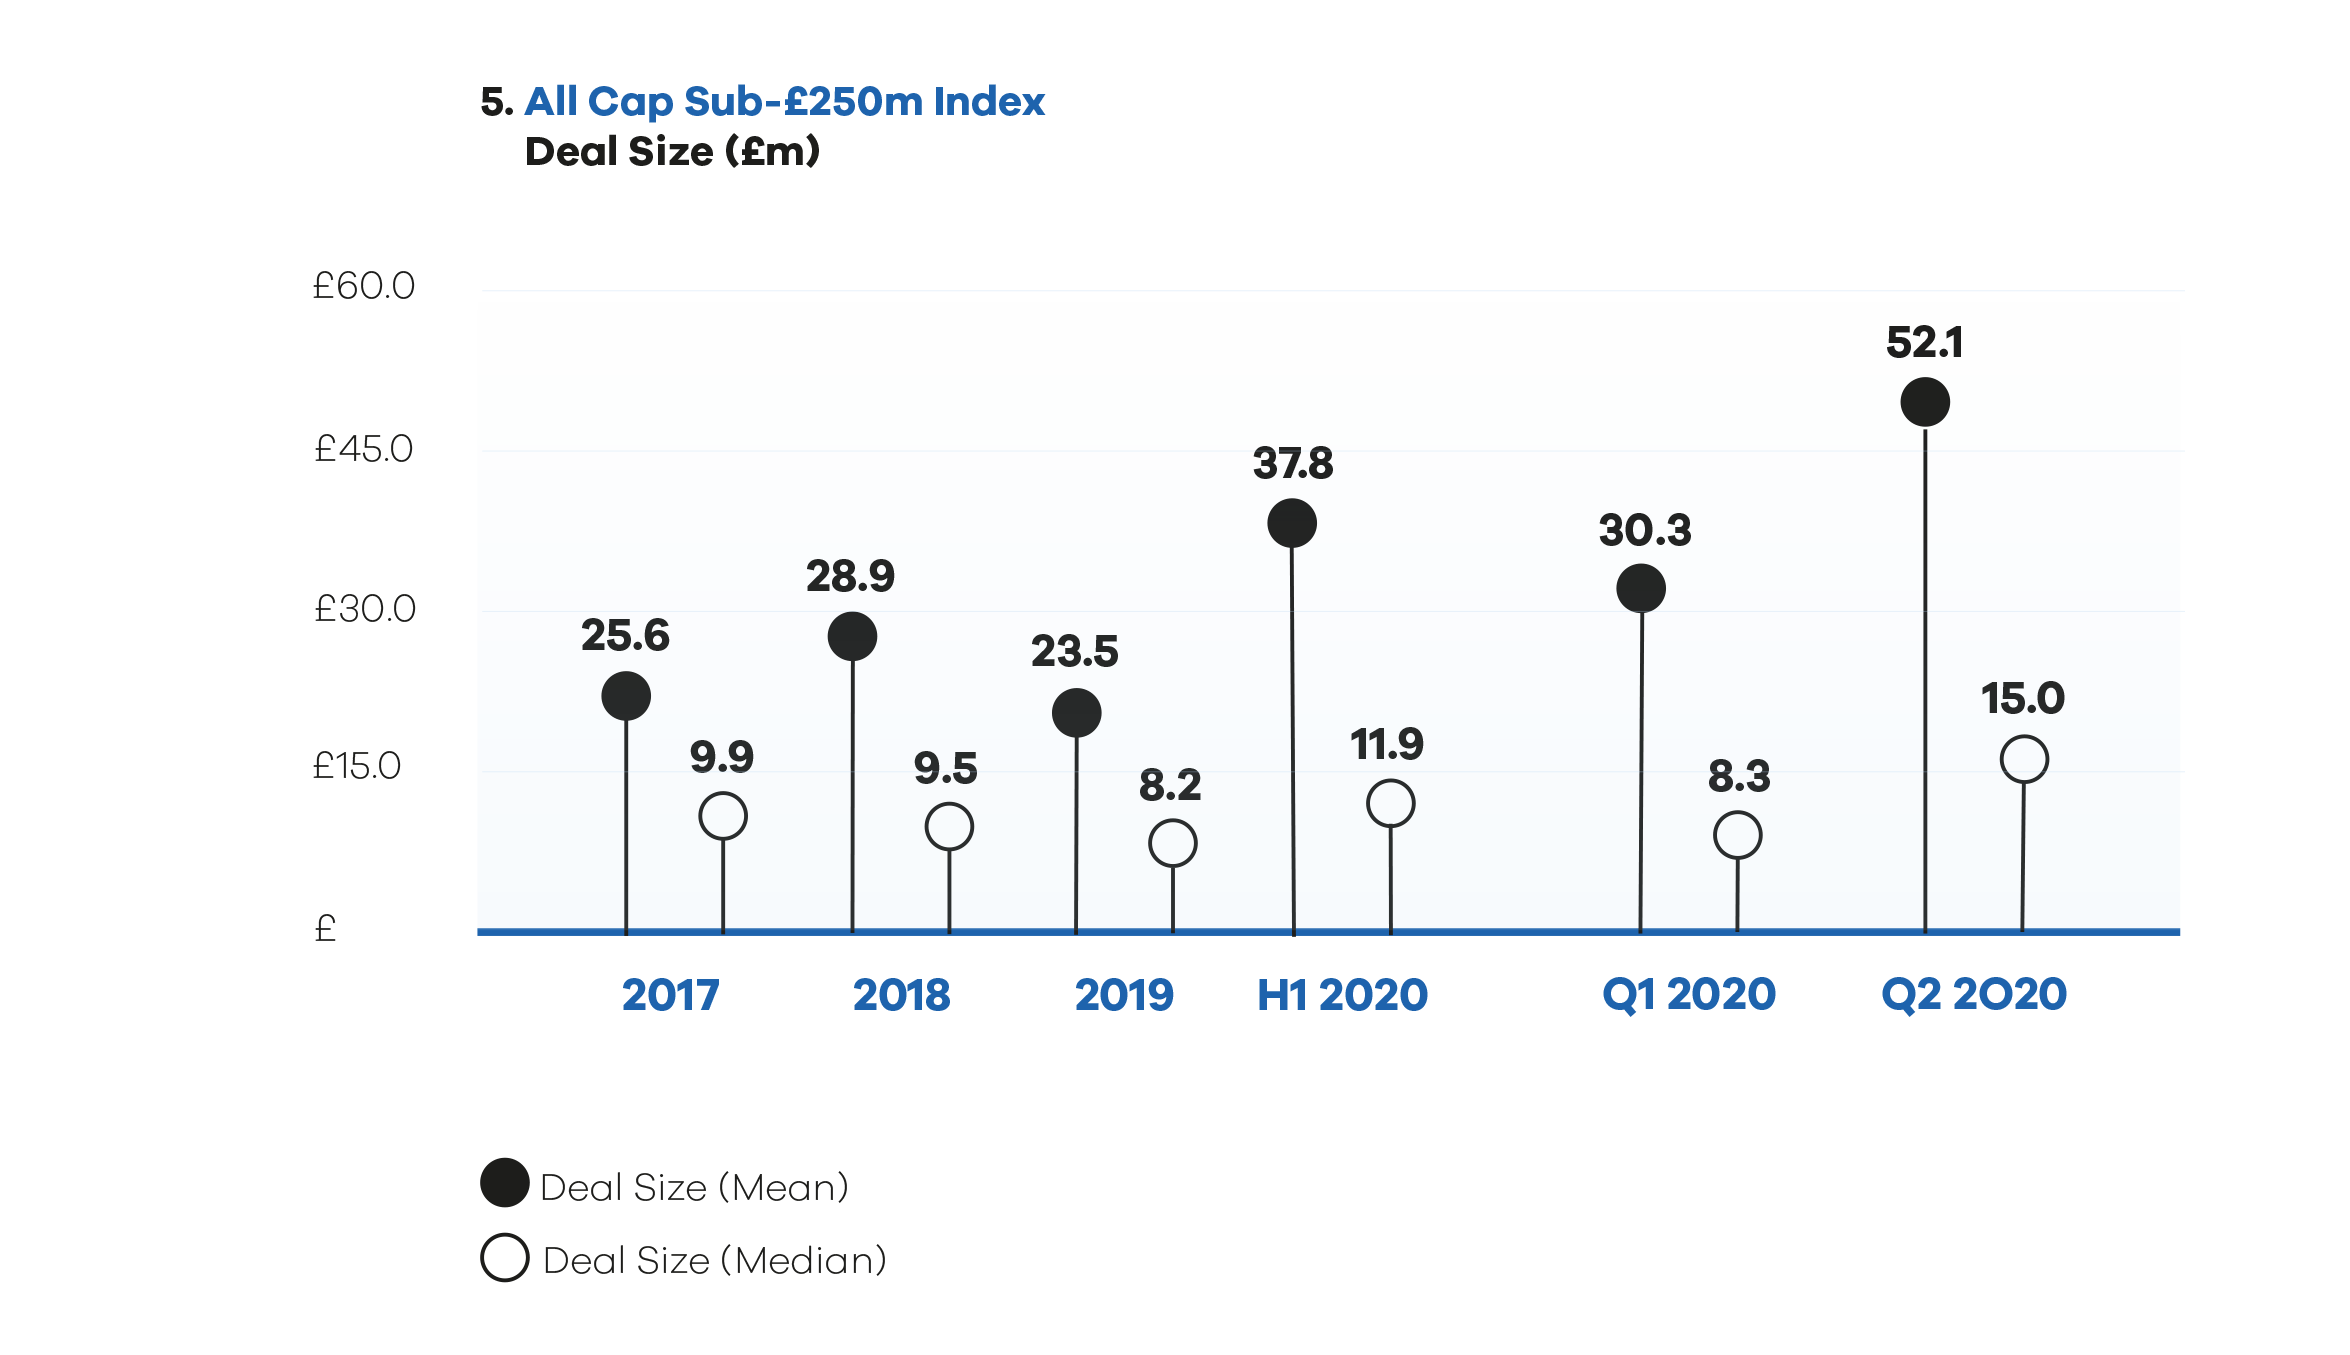
Unlike indices comprised of publicly traded assets, where the same (or a similar) basket of constituents is priced daily, transaction based indices, such as those compiled by MarktoMarket, represent collections of different constituents. The result is that outputs may be skewed depending on the specifics of the companies acquired in each period. Deal completions were down 43% quarter-on-quarter during the first half. Whilst this alone will not skew aggregate multiples it does make outputs less statistically significant. Also, in the second quarter M&A targets were skewed towards sectors with traditionally higher multiples and the mean and median deal size was materially higher relative to Q1 (transaction values and multiples are positively correlated).
Size BASED iNDICES
 When we look underneath the aggregate data into our size-based indices, the data becomes more insightful. It is clear that, whilst multiples were supported in H1 2020 at the ‘Small’ and ‘Mid’ ends of the market, valuations in the ‘Nano’ and ‘Micro’ worlds softened in the first half of 2020 relative to 2019. Furthermore, valuations continued to weaken in the second quarter versus the first quarter for our Nano, Micro and Small samples, whilst multiples expanded in our Mid and Large groups in Q2 versus Q1. This may represent a tendency for buyers to favour larger assets, where the perception is that risk is lower, over smaller acquisition targets in a market saturated by volatility and uncertainty.
sECTOR BASED INDICES
Within sectors, our Technology, Media & Telecommunications (“TMT”) Index posted a gain in the first half of 2020 versus 2019; the Industrial & Business Support (“I&BSS”) Index was broadly flat (although I&BSS was weak in 2019 relative to 2017 and 2018); whilst Consumer weakened, although witnessed a recovery in the second quarter versus the first quarter. We have introduced two new sector indices – Financial Services and Healthcare – for the first time.
The full report with deal tables and multiples is available to customers and members of the MarktoMarket Data Co-operative. Previous Indices Reports can be accessed here.
Download the Report
The executive H1 2020 M&A Valuation Indices report is available to anyone working in advisory or investment teams.