UK M&A Valuation Indices H1 2024
report Highlights
Highlights from our 2024 UK M&A Valuation Indices, covering UK M&A transaction multiples for M&A deals completed in January – June 2024.
There was a continuation of softer deal volumes and multiples in the first half of 2024. Provisional deal volumes were down 14% versus the same period in 2023 as geopolitical and economic factors weighed on M&A markets.
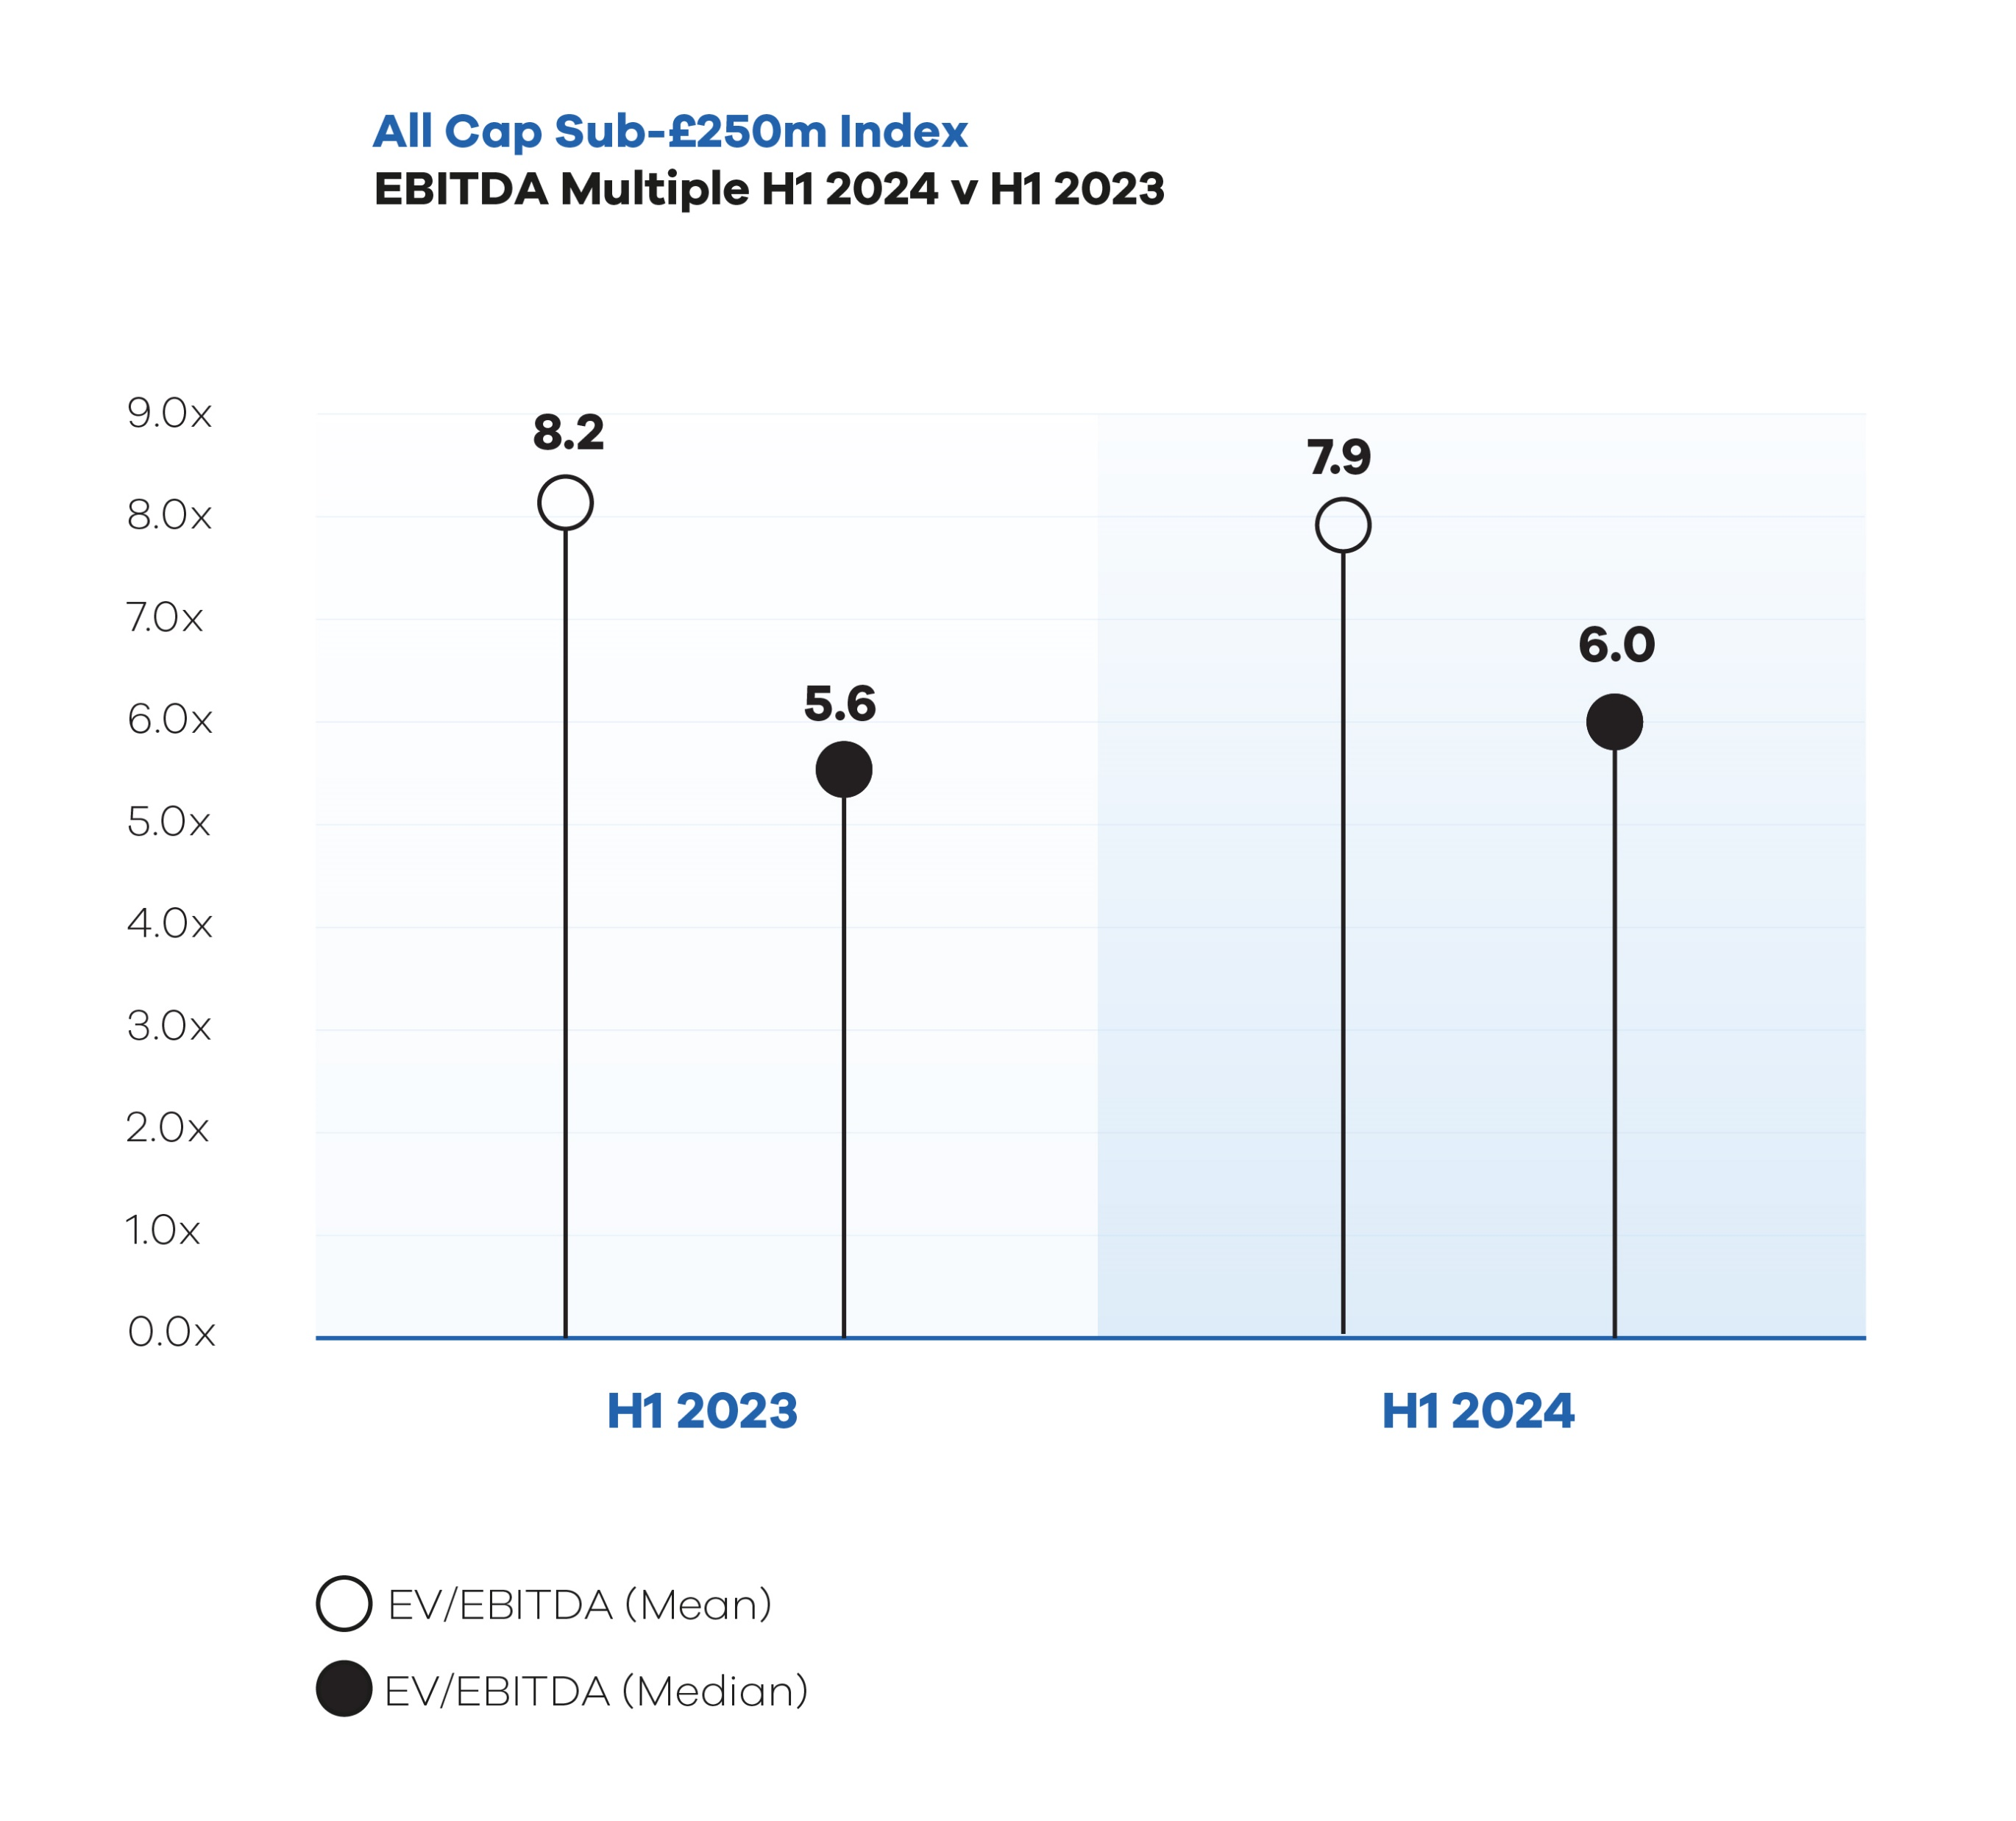
Our All-Cap Index suggests a small improvement in deal multiples relative to the first half of 2023. The median All Cap EV/EBITDA multiple was 6.0x versus 5.6x in H1 2023. However, some of this improvement may be attributable to the allocation of transactions in the sample between size bands.

In addition to the All Cap Index (all deals under £250 million), we present five size indices. This is in order to help our customers understand, justify and defend size-related discounts and premia.
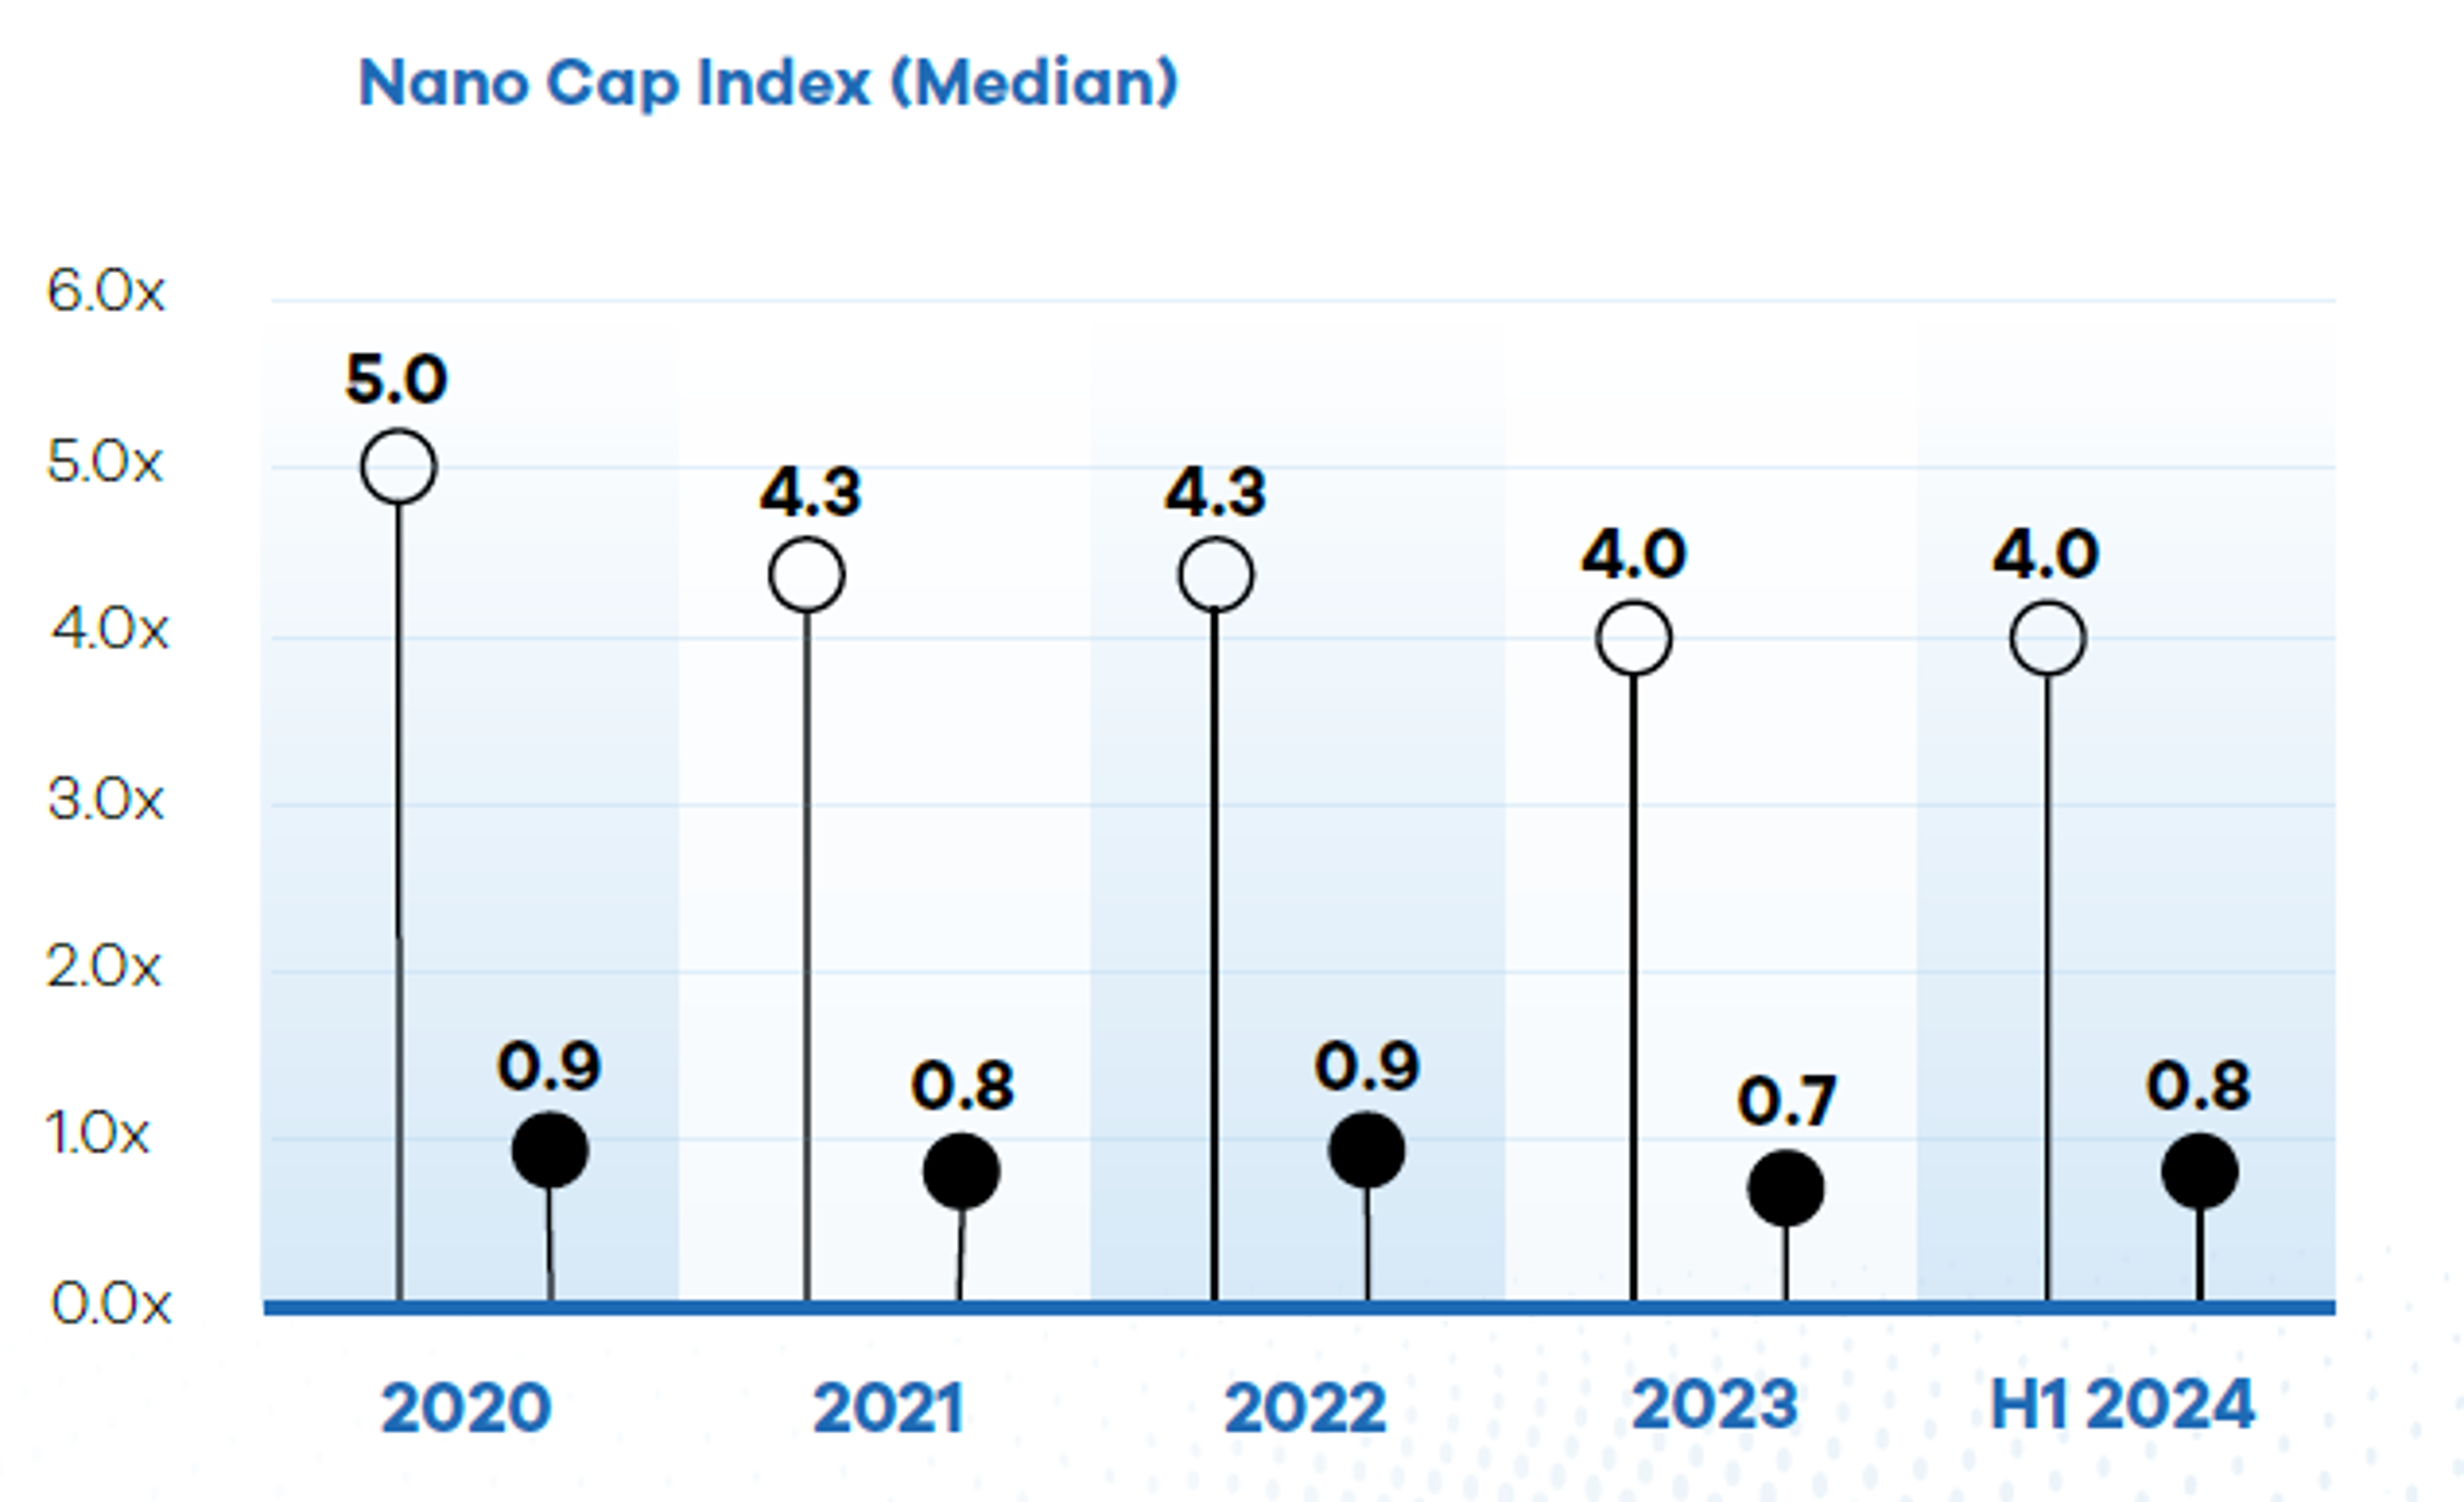
The Nano-Cap index, which consists of M&A transactions valued at under £2.5m, is designed to be representative of the smallest companies in the UK. Due to the limited disclosure requirements imposed upon the UK’s smallest private companies, information is sparse. However, MarktoMarket’s technology and in-house research team, alongside contributions
from our customers, allow us to create an index for these tiny companies.
Our provisional data suggests that EBITDA multiples in sales of businesses valued at under £2.5 million remained the same in H1 2024 when compared to 2023.

SECTOR-BASED INDICES
The Industrials & Business Support Services (“IBSS”) sector remained the largest contributor to the indices in H1 2024, accounting for half of the transactions in our sample.
Request the executive report below. Please contact olga@marktomarket.io to discuss access to the full versions of all MarktoMarket Reports.
For the full list of previous reports visit our reports page.
Request the Report
Submit the form for the executive report.