UK M&A 2022 Valuation Indices Full Report
report Highlights
Highlights from our 2022 UK M&A Valuation Indices, covering UK M&A transaction multiples for M&A deals completed in January – December 2022.
After a very strong 2021 for the M&A industry, 2022 saw a decline in deal multiples. The MarktoMarket All Cap Index, which represents the median Enterprise Value to EBITDA (EV/EBITDA) multiple paid during the year, excluding outliers, was 6.9x. The comparison for 2021 was 8.2x.
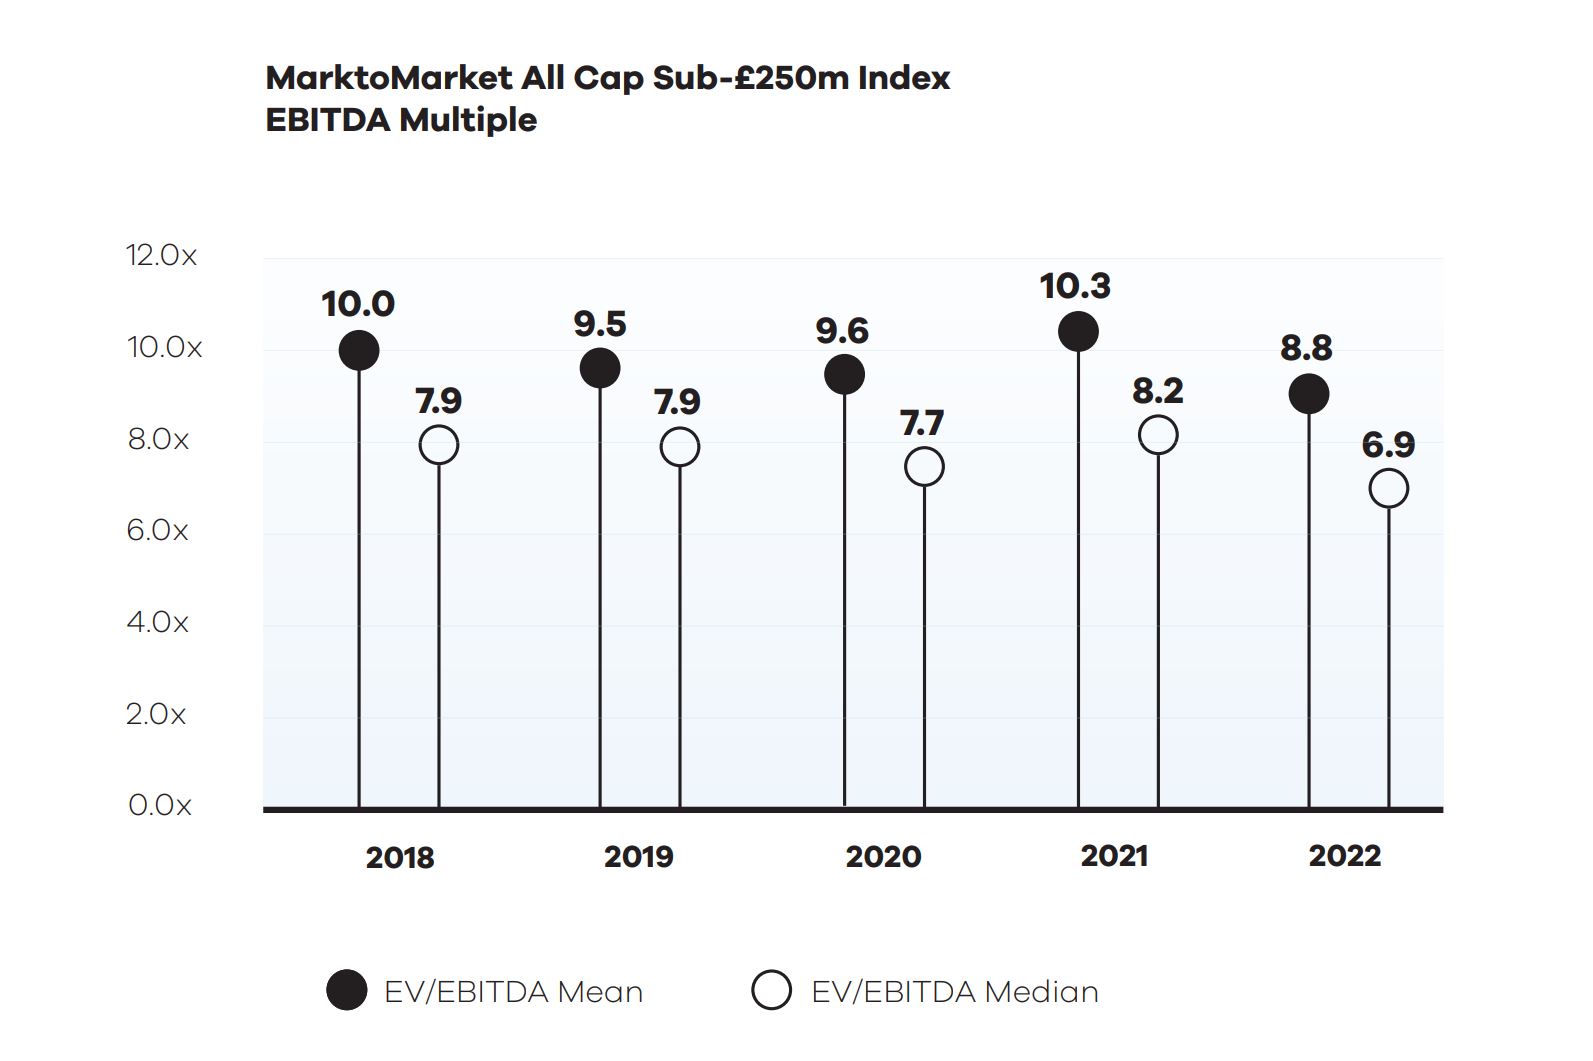
In addition to the MtM All Cap Index (all deals under £250 million), we present five size indices. This is in order to help our customers understand, justify and defend size-related discounts and premia.
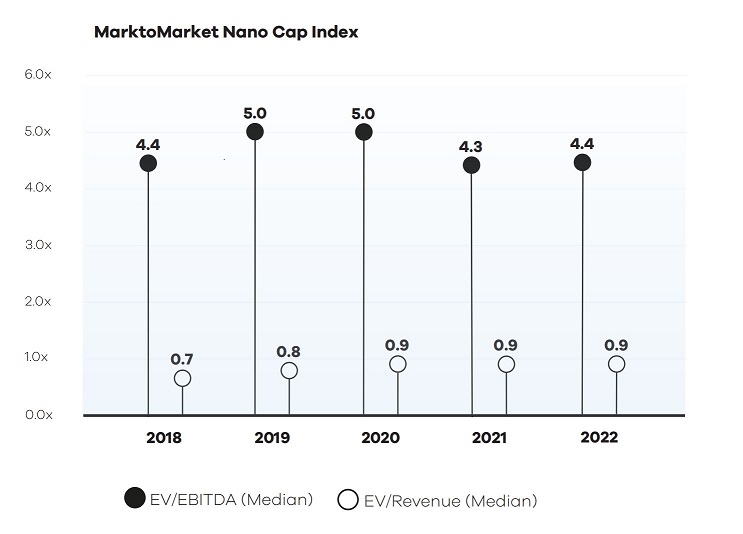
The Nano-Cap index, which consists of M&A transactions valued at under £2.5m, is designed to be representative of the smallest companies in the UK. Due to the limited disclosure requirements imposed upon the UK’s smallest private companies, information is sparse. However, MarktoMarket’s technology and in-house research team, alongside contributions
from our customers, allow us to create an index for these tiny companies.
Our data suggests that multiples in the Nano-Cap index remained relatively flat when compared to last year. Given falls in other indices, this resilience in pricing amongst the UK’s smallest companies is surprising but, perhaps, indicative of different dynamics at this end of the market.
SECTOR-BASED INDICES
Within sectors, The Technology, Media& Telecommunications (TMT) Index continues to demonstrate a significant valuation premium over both the Consumer and Industrials & Business Support Services (I&BSS) Indices.
Request the executive report below. Please contact olga@marktomarket.io to discuss access to the full versions of all MarktoMarket Reports.
For the full list of previous reports visit our reports page.
Request the Report
Submit the form for the executive report.