Q1 2021 UK M&A Valuation Indices
report Highlights
Our latest UK M&A Valuation Indices cover transaction multiples for M&A deals completed in the first quarter of 2021.
M&A markets were exceptionally buoyant in the first quarter of 2021. March 2021 was the busiest month on record, as measured by M&A deal completions. A total of 635 deals were
executed, versus 418 completions in March 2020.
The MarktoMarket All Cap Index, representing the mean Enterprise Value to EBITDA (EV/EBITDA) multiple paid in UK M&A deals in Q1 2021, excluding outliers, was 9.1x. The 2020 comparison was 9.7x. Multiples trended lower in the second and third quarters of 2020 before recovering in Q4 2020.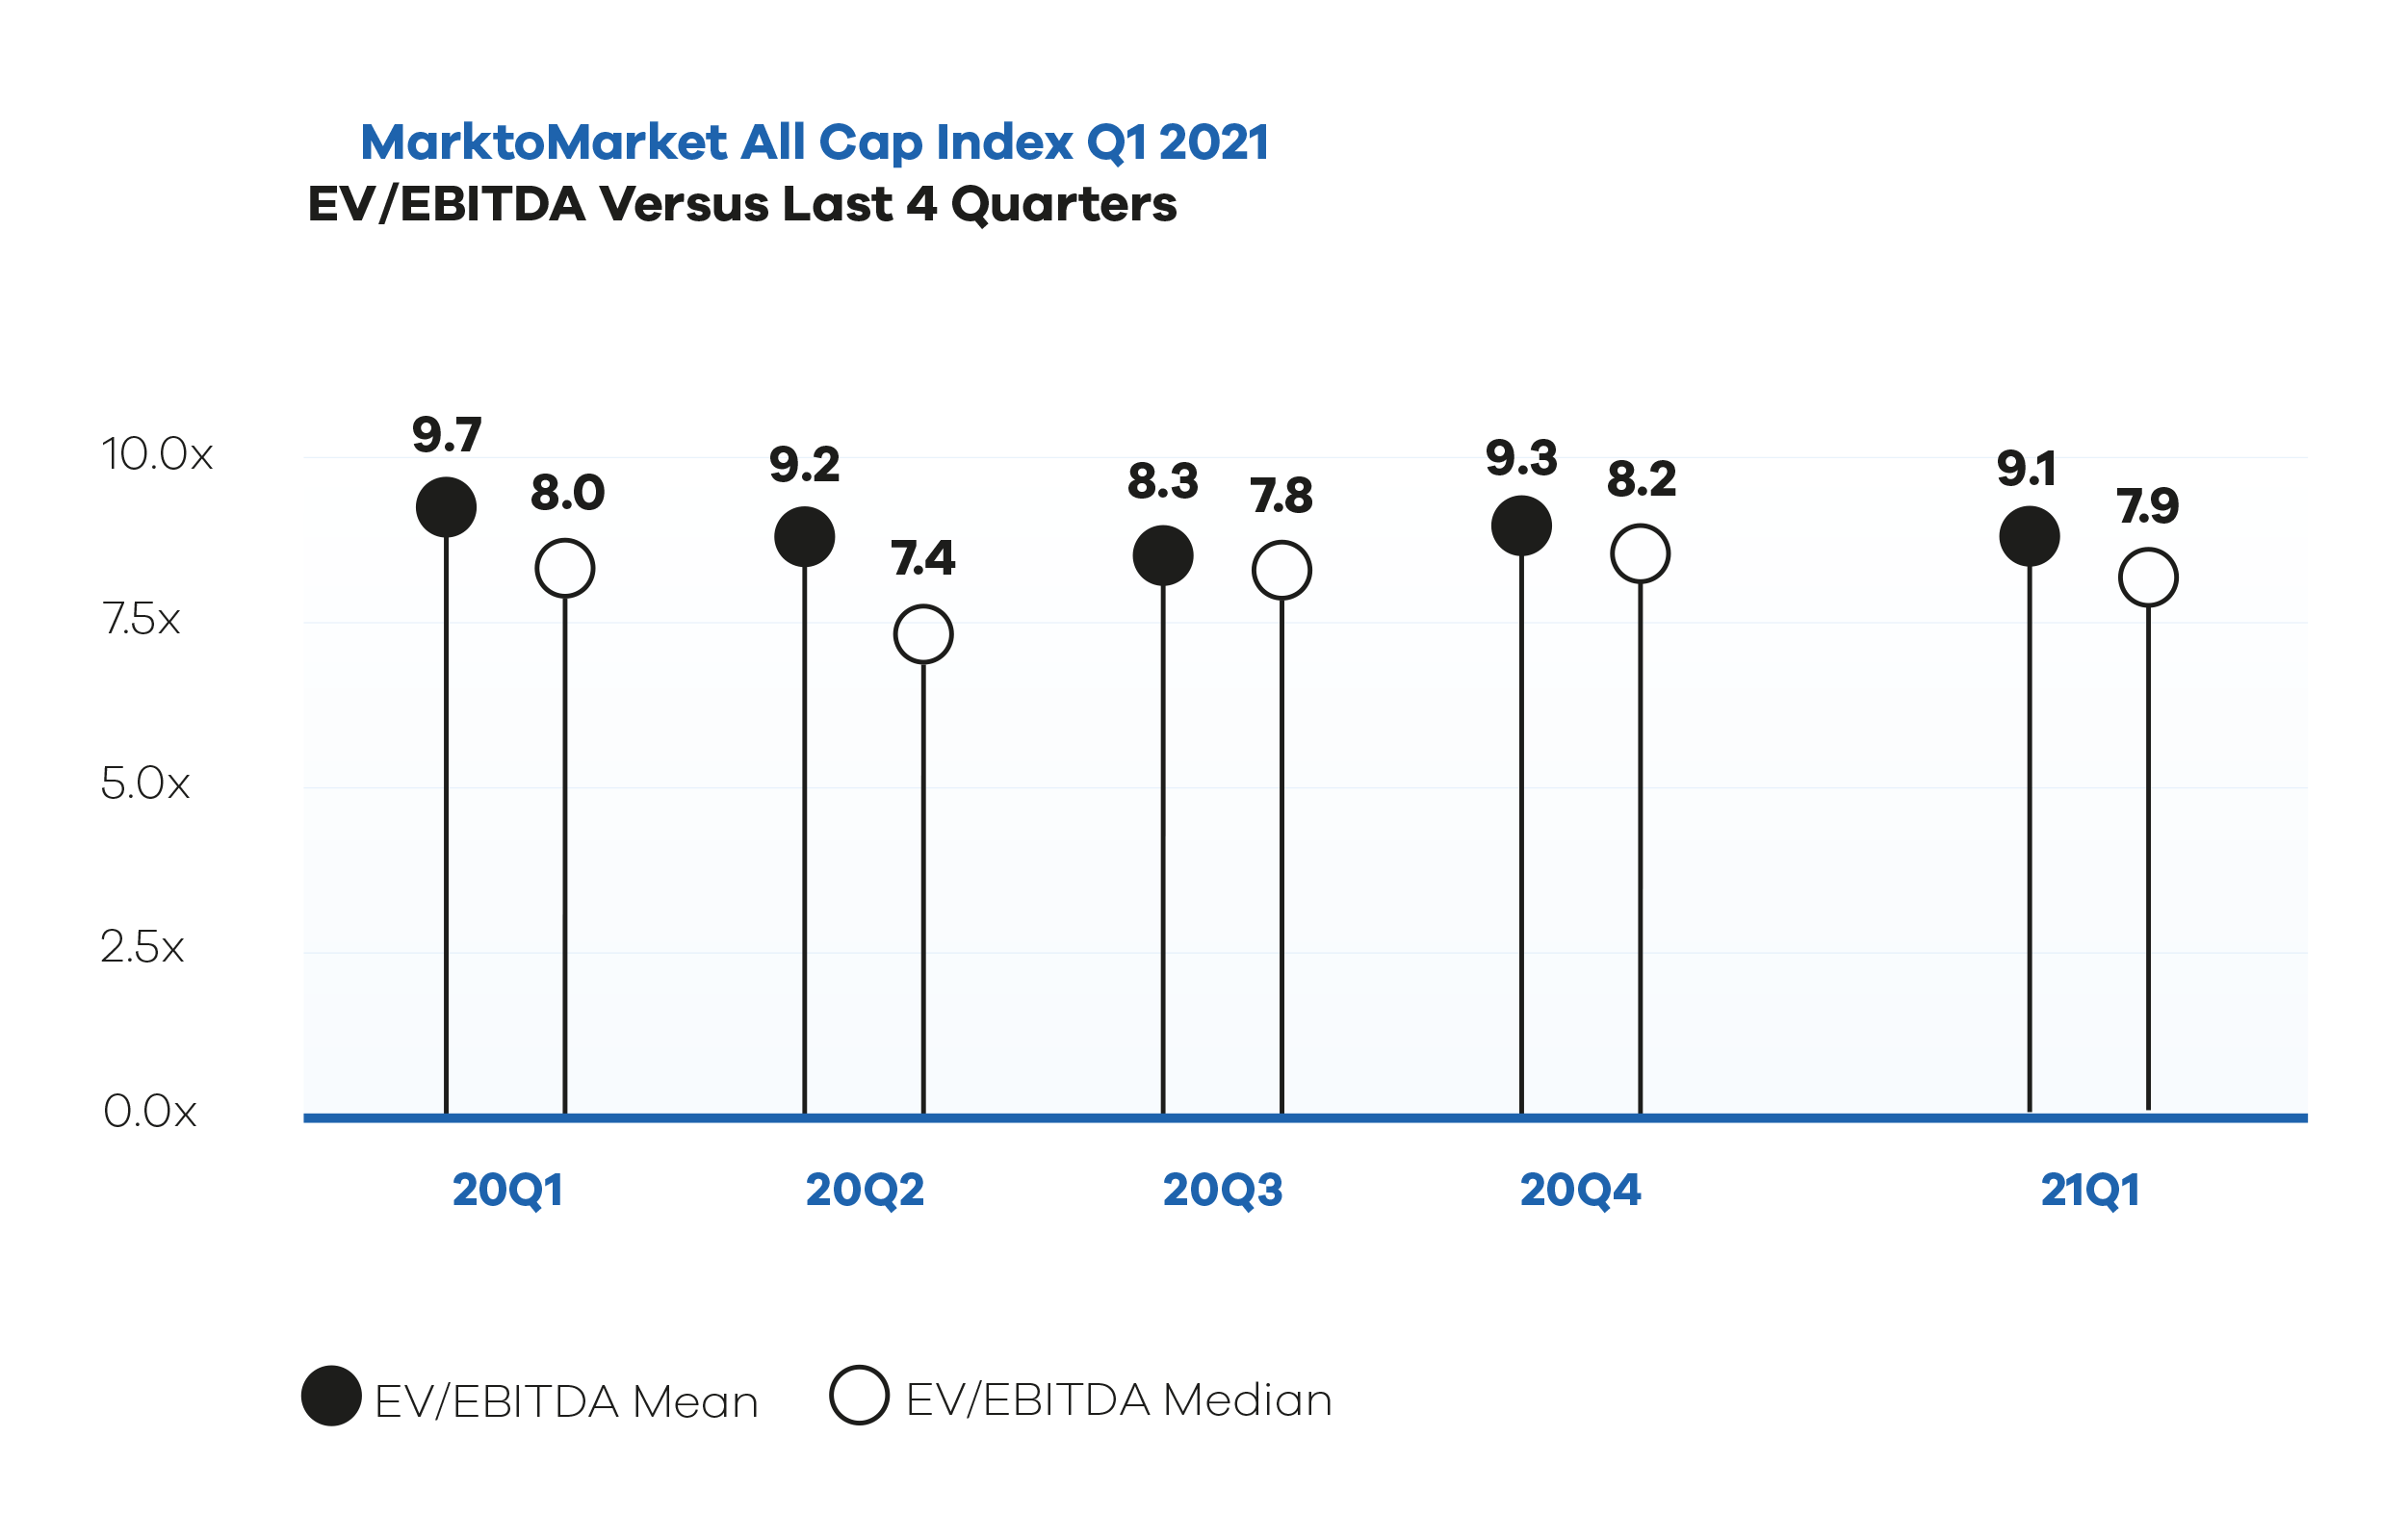
deal size
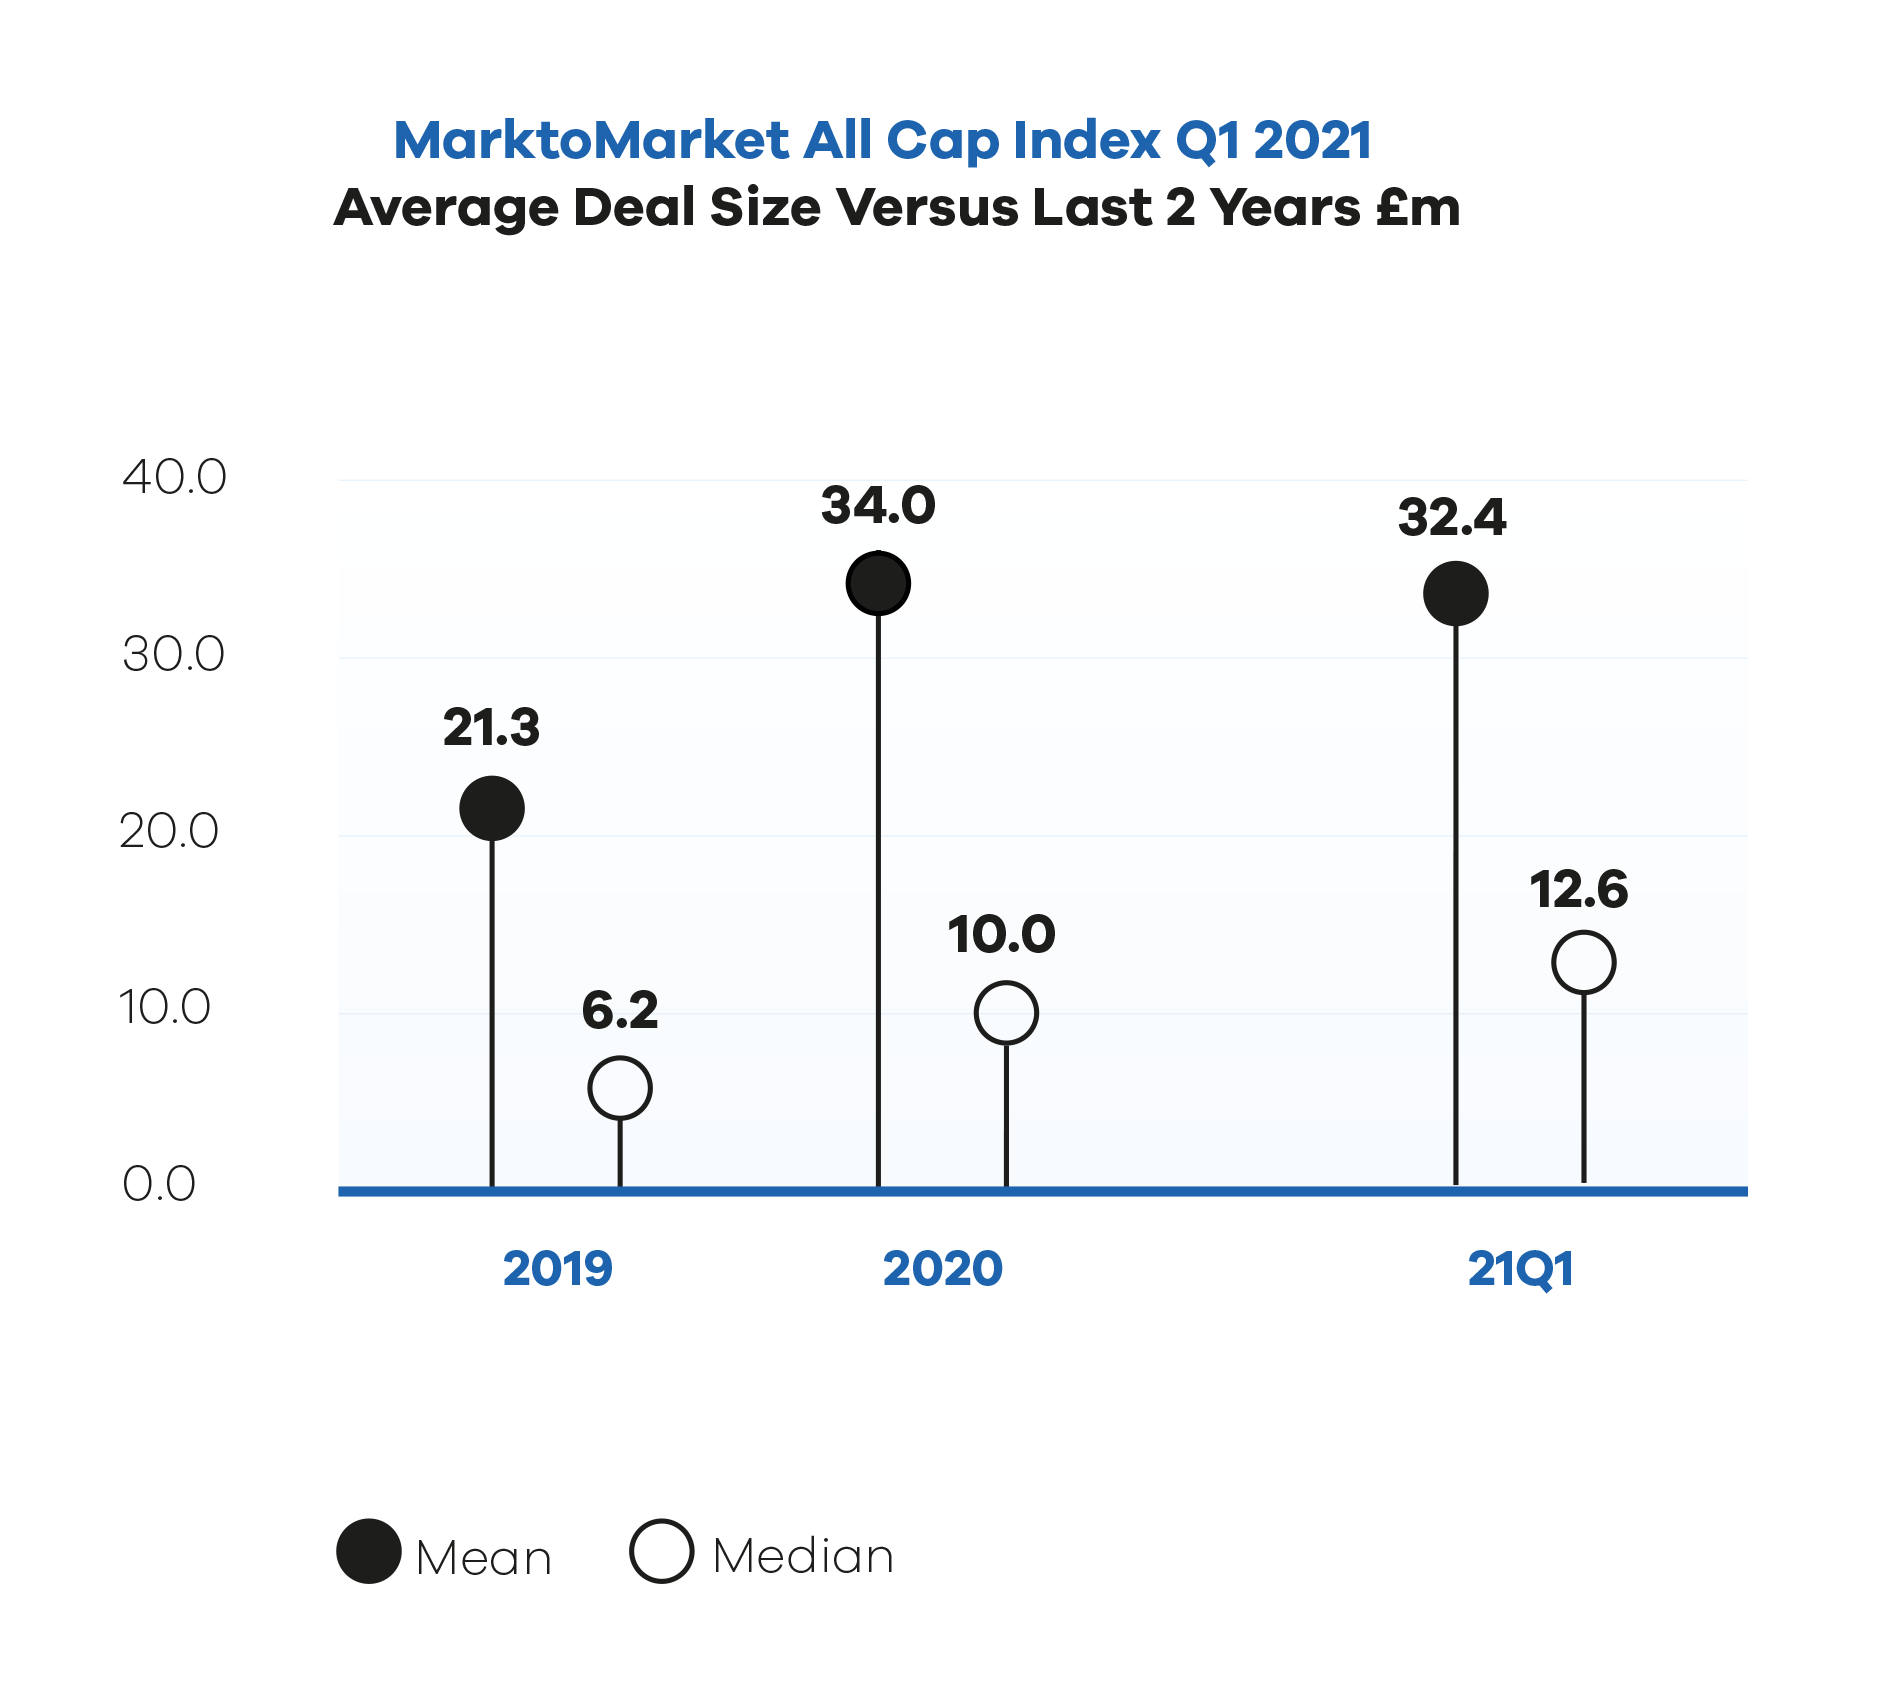
The mean deal size in our sample was £32.4 million in Q1 2021 versus £34.0 million in 2020. The median increased to £12.6 million from £10.0 million.
Please note that the chart implies only the movement in deal values within our datasets that feed into these indices and not necessarily the average deal value movement across the entire market.
SECTORs
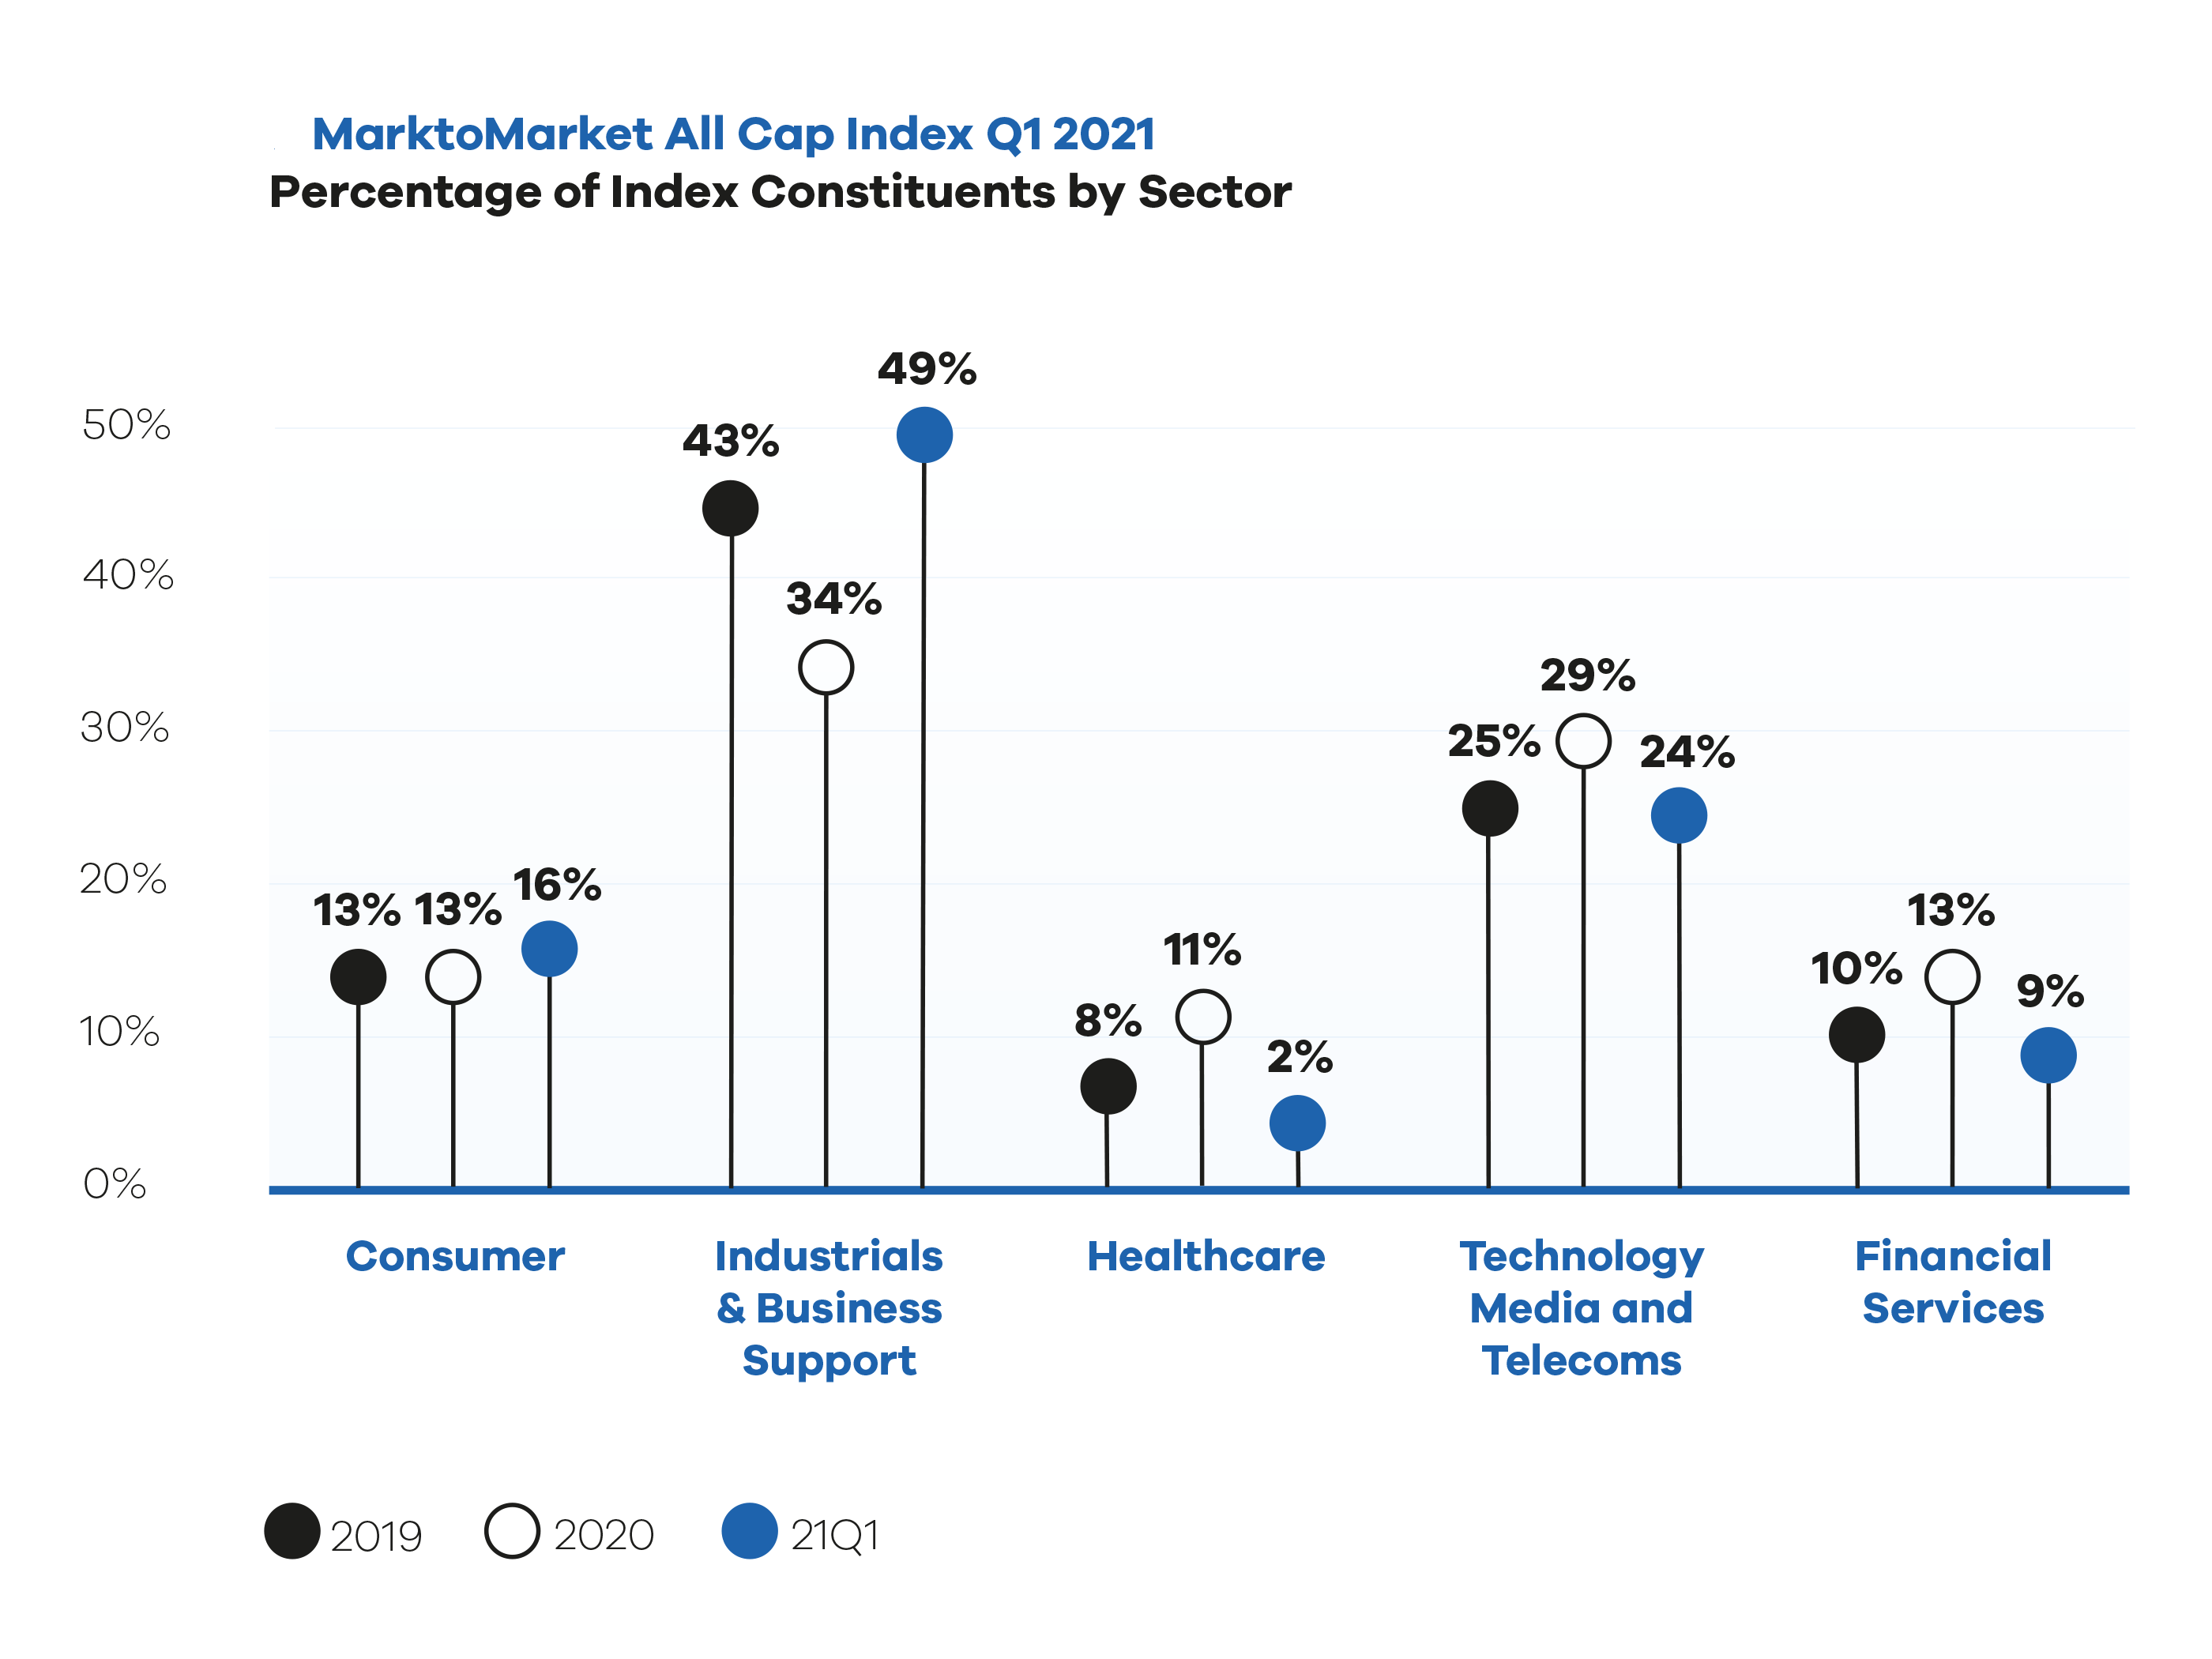
There was a greater incidence of Industrials & Business Support Services transactions within our sample in Q1 2021 relative to 2020 and 2019. As this sector tends to attract lower multiples than, for example, Technology, Media & Telecommunications, a higher preponderance of deals in this area would, all other things being equal, drive aggregate multiples lower.
Request the executive report below.
For the full list of previous reports visit our reports page.
Request the Report
Submit the form for the executive report.